DAX About To Drop


The German index, the DAX, has been Europe’s shining light in recent years. But dats about to change if my analysis is correct. Let’s proceed with a top down approach beginning with the yearly chart to put it all in perspective.
YEARLY CHART

Now, what is clearly evident here is a pattern of higher lows and higher highs – a bull market. After the high in 2000, price came back to put in a low in 2003. This was a higher low so did no structural damage to the long term bull market. The 2007 high, while not breaking the 2000 high, set up a double top. Price then made a low in 2009 which did not break the 2003 low so no technical damage there. And as double tops generally don’t end trends, it was no surprise to see it busted last year.
This year has witnessed an all time high of 10050. Price has retreated from those highs. So, what can we expect going forward? In one word, gloom.
I have added a Relative Strength Indicator (RSI) and a Stochastic indicator. And just at look at the bearish divergences that have formed since the high in 1986. No, dat wasn’t a typo. Neither was dat. Ever since 1986, the DAX has been losing strength. The Stochastic shows a second bearish divergence setting up while the RSI, amazingly, shows a third bearish divergence. And on the yearly chart! Incredible stuff.
So, considering a big move down looks in the works, to help determine where a low may form I have added Fibonacci retracement levels of the upleg from the 2003 low to recent all time high. I have identified what I believe to be the three most likely scenarios. What are they?
The first is a pullback to the 61.8% level at 5192 and can be seen in the green highlighted circle. This is above the previous major swing low set in 2011 and pulling up there would keep price in a strong bullish position.
The second is at the 76.4% level at 4044 and can be seen in the orange highlighted circle. This is below the 2011 swing low but above the 2009 swing low. That would weaken the technical picture but still not break the massive bull market.
The third scenario is the most bearish scenario of those I’ve identified and can be seen in the yellow highlighted circle. It involves price plunging all the way back to the 88.6% level at 3085. This is still above the 2003 low so would still leave some hope that the massive bull market is still in play. But there will certainly be question marks over its long term potential if this scenario plays out.
What is my opinion? Thought you’d never ask! Considering the massive bearish divergences showing up, I favour the two most bearish options – the orange circle or yellow circle scenario. Out of those two, I prefer the orange circle scenario as I still want to give bias to the continuation of the long term bull market. But there’s still plenty of time to investigate that more thoroughly in the future.
Let’s now move on to the monthly chart.
MONTHLY CHART
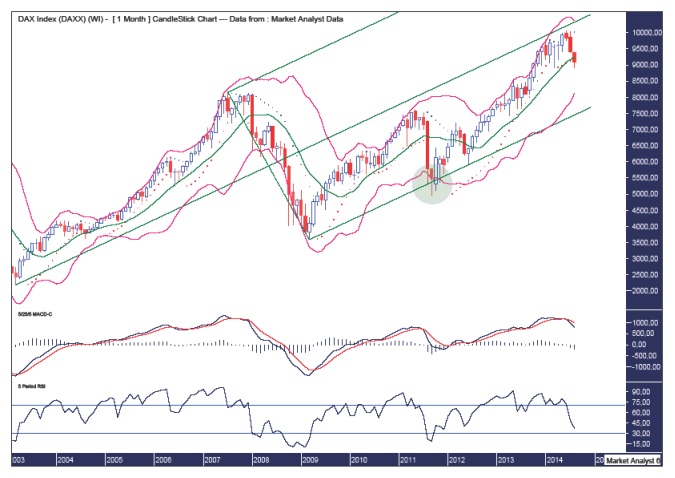
We can see price put in an all time high back in June and has since retreated from those levels. I have added a Parabolic Stop and Reverse (PSAR) indicator which shows price busting the dots to the downside this month. A bearish development.
I have also added Bollinger Bands which shows price moving away from the top band and currently being situated around the middle band. This is it’s chance to turn back up and resume the bull trend. But I doubt that will happen.
I have added a Moving Average Convergence Divergence (MACD) indicator which shows a bearish crossover last month. The red line is now clearly above the blue line indicating more weakness is likely in the months to come.
Also, the RSI is down in weak territory and still trending down. There is plenty of room for this indicator to get weaker still. Bias clearly has to be given to lower prices going forward.
I have added an Andrew’s Pitchfork which is denoted by the green parallel lines. We can see ever since the 2009 low, the bull trend has steadily gone about its business in the lower half of the structure. Price recently made an attempt to head up into the more bullish top half but was repelled. The last time price was repelled away from the top half, it pulled all the way back to the lower trend line even dipping below it before reversing back higher. This can be seen in the green highlighted circle.
So, perhaps price can come back for another attempt at the lower trend line. However, considering those massive bearish divergences on the yearly chart, I reckon price will break right down through there. Let’s see.
WEEKLY CHART

I have added Bollinger Bands and price can be seen recently moving from the upper band to now be ensconced in the lower band. Things don’t look good. For the bulls, that is.
I have also drawn two black uptrend lines. Price has already busted the steeper trend line and is now threatening to bust the next trend line. Dat appears inevitable in my opinion. We’ll know either way shortly.
I have added a RSI and Stochastic indicator with both in extremely weak territory. This can be very deceiving when big new moves down are beginning. While such a weak reading suggests a rally is just around the corner, this is also the exact point where things can get ugly. I’d be a nervous little Nellie if I was betting on a substantial move back up. But I’m not nervous and I’m certainly not betting on a move back up.
Now, let’s finish up by zooming right in for the close up. The daily chart.
DAILY CHART

I have denoted several highs and lows with numbers 1 through to 5. This chart shows a 5 point broadening top. That is bearish although a 7 point broadening top is also possible and even more bearish. If it is going back up then now is the time. However, the analysis already presented is negative so I doubt we’ll see one final high to make that seventh point.
I have added Fibonacci retracement levels of the move down from all time high to recent low. If this is only a bear market rally, then I favour price rallying to either the 50% level at 9477 as shown in the green highlighted circle or the 61.8% level at 9612 as shown in the yellow highlighted circle.
I have added Bollinger Bands which show price recently bouncing off the lower band and finding resistance at the middle band. But I favour a move back to the top band which should be around the 61.8% and 50% levels in the coming days.
Finally, the MACD shows a bullish crossover recently which tends towards price rallying further. However, it is in weak territory so I’m not that enthused by it much.
Germany’s economy has been the star performer of the European Union in recent years, rising to great heights. On the flip side though, the greater the rise the greater the fall. All I know is that if I was a DAX bull right now, I’d be saying a few heil Mary’s.


