The Deadly Undercurrent Of Deflation


Despite the overall positive state of U.S. equities and the improvements in the retail economy, the stealth enemy known as deflation is still lurking in the shadows.
Consider the following graph of real disposable income, courtesy of Zerohedge.com. This shows the true underlying state of the real economy and is a testament to the continued presence of deflation.
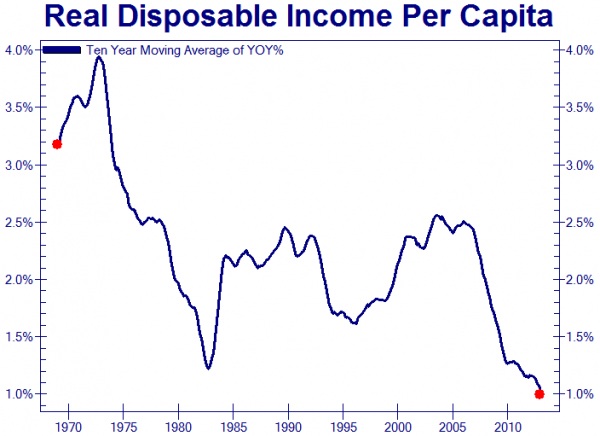
Commenting on the plunge in disposable real income, David K. Barker (www.marketcycledynamics.com) wrote: “The most shocking thing about [this] is that disinflation is on the verge of deflation when the pumps were running at $85 billion a month. The only real solution is to restore the pricing mechanism of markets, give Mr. Market the deflation he wants, and the global economy can move into the coming long wave spring season sooner rather than later.”
The good news is that the long-term deflationary cycle responsible for suppressing income and wages is scheduled to bottom later this year. What’s troubling, however, is that deflation wasn’t allowed to work its magic in cleansing the economy of imbalances, including (and especially) high retail prices. The Zero Interest Rate Policy (ZIRP) of the Federal Reserve has kept many producers in business which should have gone out of business during the credit crash. Moreover, ZIRP has obscured the total impact of deflation on financial assets and consumer prices. When the next long-term inflation cycle kicks off in 2015, we’ll be starting from a much higher price level than we would have if deflation was allowed to proceed unchecked.
The Fed’s monetary policies of the last few years were undertaken with the idea of throwing everything but the kitchen sink at deflation. Politically speaking, deflation is unacceptable to Washington since it means lower corporate profits, hence (temporarily) lower tax revenues. The long-term benefits of allowing deflation to run its course, however, are boundless. With the 60-year Kress cycle in its final year of descent, a final flare of deflationary pressure in the global economy can’t be ruled out.
As it turns out, even the IMF is concerned over the possibility of deflation re-emerging this year. In a recent Businessweek article entitled, “The Lurking Threat of Deflation,” IMF Managing Director Christine Lagarde was quoted concerning Europe’s slow economic recovery and its potential impact on prices. “We see rising risks of deflation,” she said, “which could prove disastrous for the recovery.”
Lagarde’s attitude toward deflation is made obvious by her choice of words: “Deflation is the ogre that must be fought decisively.” This is how virtually all central bankers and politicians feel about deflation; it’s an “ogre” that must not be allowed to rear its ugly head. If only they had the courage and foresight to simply stop fighting deflation and let nature take its course. The global economy would be so much the better for it.
While the effects of deflation aren’t discernible in U.S. stock market performance, investors aren’t so easily fooled. They’re still worried about the potential impact of an emerging market crisis or a China credit crunch and they obviously believe deflation is a very real threat in the coming months. This can be clearly seen in the charts of two major safe haven assets, namely Treasury bonds and gold.
Let’s start with Treasuries. The iShares 20+ Year Treasury Bond Fund (TLT), an excellent proxy for long-term bonds, has established a new uptrend since the start of the year. Notice that TLT is above its rising 30-day and 60-day moving averages and is making an attempt at retracing its short-term losses since the Feb. 3 peak.
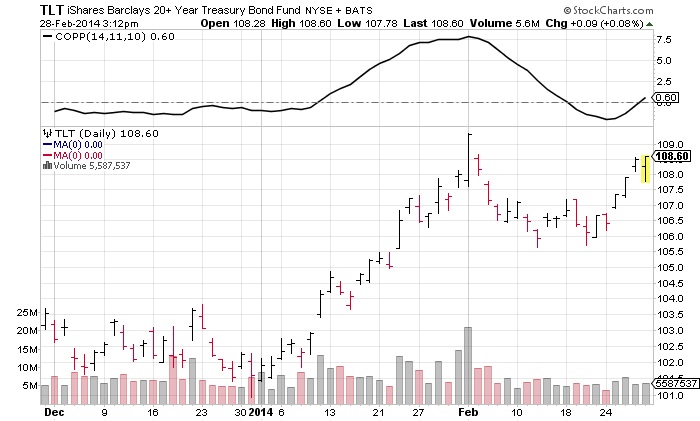
It’s also worth noting that the Coppock Curve indicator for TLT has recently confirmed a turnaround signal for long bonds. The Coppock Curve is one of the single best indicators for issuing buy signals on bonds (though it is less helpful for determining tops). The Coppock Curve is derived by adding the 14-month and 11-month rate of changes for bond prices and smoothing the result with a 10-month weighted moving average. You can see in the above chart that this indicator turned up just a few days ago and is signaling a period of outperformance for Treasuries.
The recent Coppock Curve buy signal for bonds, assuming it pans out, means that Treasury yields will be declining while bond prices rise. Declining yields are very much consistent with the Kress cycle scenario for 2014, which suggests that disinflationary if not outright deflationary pressures will increase until the long-term cycles bottom later this year.
The other major safe haven asset which investors have recently been flocking to is gold. The yellow metal has rallied for the last two months on a combination of emerging market uncertainty and technical factors.

I’m often asked why, if the long-term deflationary cycle is still down until, should investors be interested in gold? After all, isn’t gold known for being a hedge against inflation? I lately came across one very good answer to this question. Charles Gave of GaveKavel writes in his latest article, “Gold as a deflation hedge,” that gold becomes for many investors the preferred substitute for international assets in a diversified portfolio. And since the monetary and fiscal policies of the nations is mixed and confused, gold becomes the ideal hedge against bad policy as well as equity bear markets.
Below is a chart produced by Gavekal Data/Macrobond. It shows the performance of gold in Brazil’s currency versus the country’s Bovespa stock index.

“Fed policy risk offers another motive for gold-hoarding in emerging markets (EM),” writes Gave. “If US monetary policy adds to the volatility of EM exchange rates, then residents need to hedge against this—and, as mentioned, their hedging options are limited. This is how we get the bizarre situation where holding gold protects against devaluation and growth/deflationary pressures in the emerging markets.”
Gave’s conclusion is that gold “will keep rising as long as US policy is exporting volatility.”
********
Kress Cycles
Cycle analysis is essential to successful long-term financial planning. While stock selection begins with fundamental analysis and technical analysis is crucial for short-term market timing, cycles provide the context for the market’s intermediate- and longer-term trends.
While cycles are important, having the right set of cycles is absolutely critical to an investor’s success. They can make all the difference between a winning year and a losing one. One of the best cycle methods for capturing stock market turning points is the set of weekly and yearly rhythms known as the Kress cycles. This series of weekly cycles has been used with excellent long-term results for over 20 years after having been perfected by the late Samuel J. Kress.
In my latest book “Kress Cycles,” the third and final installment in the series, I explain the weekly cycles which are paramount to understanding Kress cycle methodology. Never before have the weekly cycles been revealed which Mr. Kress himself used to great effect in trading the SPX and OEX. If you have ever wanted to learn the Kress cycles in their entirety, now is your chance. The book is now available for sale at:
http://www.clifdroke.com/books/kresscycles.html
Order today to receive your autographed copy along with a free booklet on the best strategies for momentum trading. Also receive a FREE 1-month trial subscription to the Momentum Strategies Report newsletter.
Clif Droke is a recognized authority on Kress cycles and internal momentum, two valuable tools which have enabled him to call most major stock market turning points from 1997 through the present. He is the editor of the Momentum Strategies Report newsletter, published three times a week since 1997. He has also authored numerous top-selling books, including his most recent one, “Kress Cycles.” For more information visit www.clifdroke.com
More from Gold-Eagle


