In-Depth Study Of 1929 And 2020 Crises


Social Injustice
In this article we present our further study of current Covid-19 virus triggered crisis and make comparison to the 1929 Great Depression crisis. The two key markers leading to financial crisis are:
- Social injustice, including the gulf between the rich and the poor, and violence in society. Witness the recent brutal murder of George Floyd on the street of Minnesota, leading to riots in other cities.
- Government Irresponsibility, especially in conducting unlimited fiat currency printing.
We feel the current situation is worse than the 1929 financial crisis.
For this study we will use some earlier charts. We will focus first on the relationship between the Dow and the Volatility, and secondly on the Gold-to-Silver Ratio (GSR).
Equity Markets & Volatility
Chart 1 – Century of Storms as represented by S&P500 versus VIX
Note 3 Regions (A, B, C) with Very High Volatility
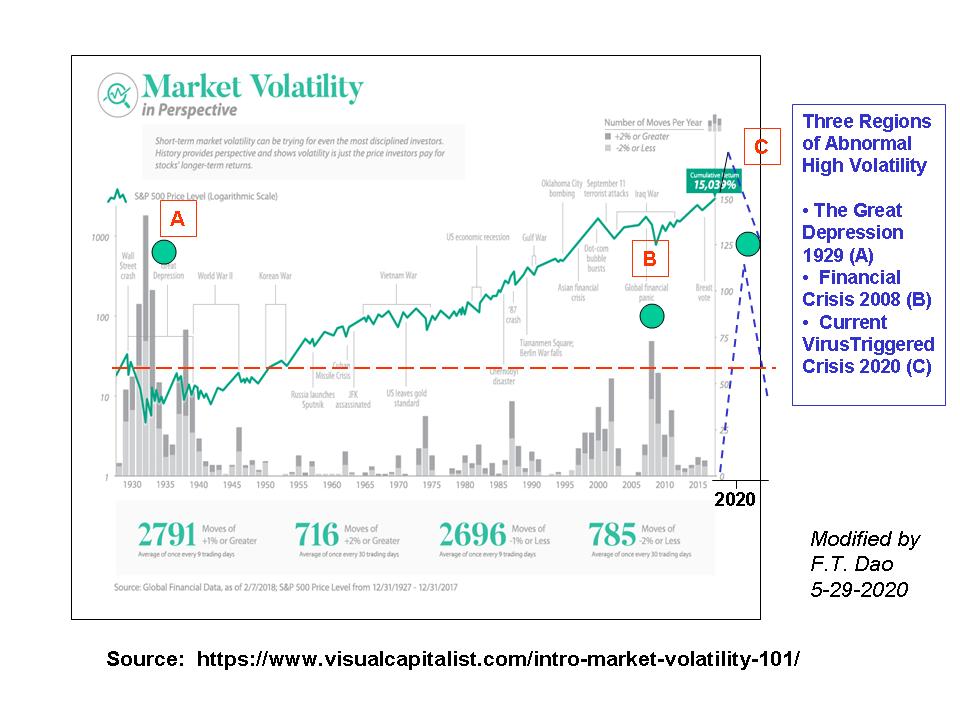
The Equity Market thrives on calmness and low volatility. So do we expect the equity market S&P500 or Dow to continue to rise?
Emerging Role of Gold & Silver
Chart 2 – Century Old Data of Gold-to-Silver Ratio
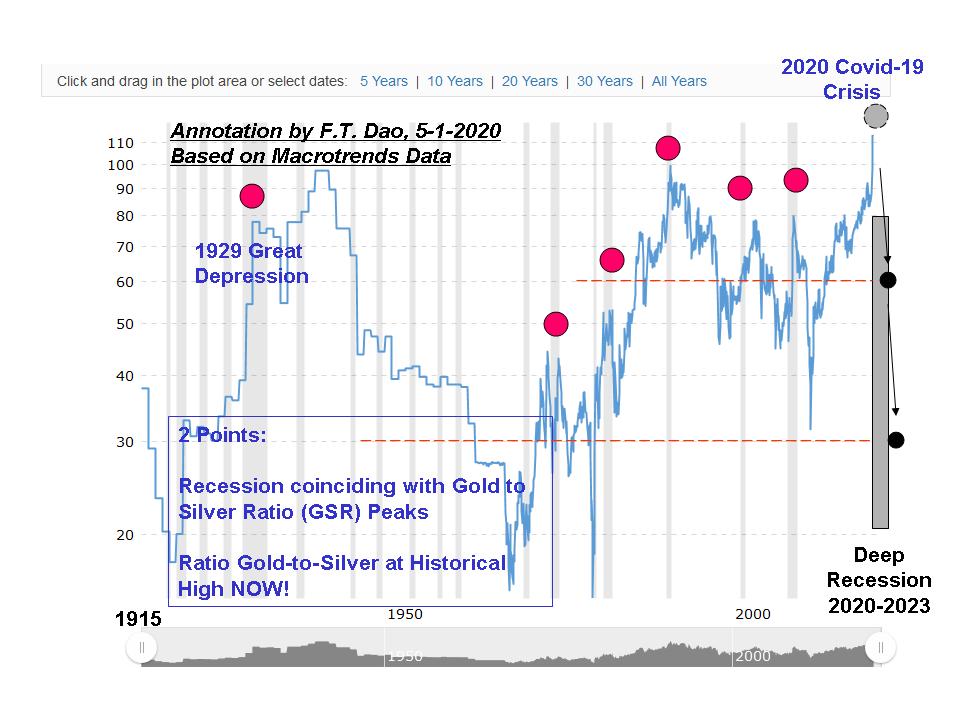
We expect GSR first drop from a historical high value of 120 to 60, and then to 30. The drop will take several years. What does the drop represent? Clearly for the 2020 crisis, it means that silver is rapidly joining gold as safe-haven money. This is Nature’s way to put a stop to unlimited currency printing, leading to a Great Monetary Reset, where gold and silver will pay an important role.
Fourier Cycle Analysis of Gold-to-Silver (GSR) Ratio
The following chart showed our Fourier cycle analysis of GSR yearly data starting in 1900. The displayed two sequential drops: first drop to 60, then to 30.
Chart 3 – Gold as Good Anchor in Storms

Recent Study of Financial Assets: Dow, Gold & Silver
The following two charts showed the results of our analyses.
Chart 4 – Dow and Volatility 1997 - Current
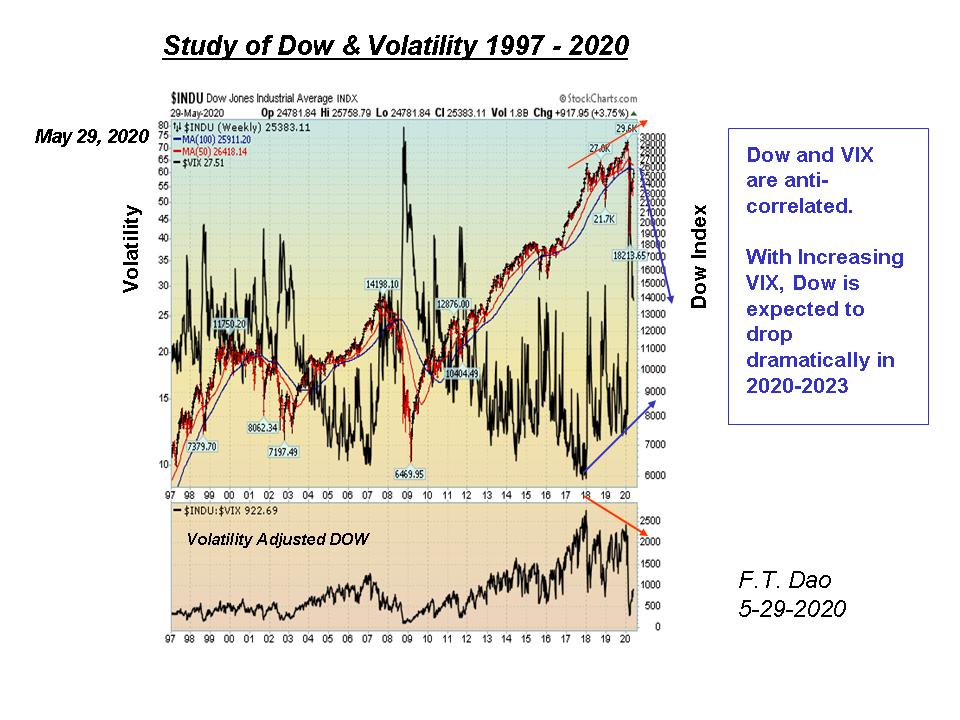
With increasing Volatility (VIX), there is limited chance for Dow to increase.
On the other hand, gold and silver will increase in value, along with the precious metal mining companies.
Chart 5 – Gold and Silver Analysis

Summary
Our analysis does not present a rosy picture, especially with respect to the general equity market. However in the midst of the social injustice riots, we learn about the SpaceX flight success. This is an uplifting experience despite Covid-19 and riots. At the same time, our faith lies in that Some-one mighty is always in charge.
“You rule the swelling of the sea; when its waves rise, You still them.”
We are not certified or qualified financial advisors. Please consult your certified financial advisors for actual trading and investing.
*********


