Elliot C Wave Blast-Off!


Gold

Gold traded to a high of 1191.00 in today’s day session, which is above last Friday’s high.
On the Intraday Chart the trading from Friday’s high of 1187.20 does not look impulsive which keeps all of our current options open.
Short term wave count:
.i. = 1158.40;
.ii. = 1144.90;
.iii. = 1177.00;
.iv. triangle = 1168.50;
.v. = 1187.20, if complete, to complete wave -i-.
It’s possible that wave .v. is subdividing and is not complete at the 1187.20 high. It is also possible that this sideway trading is part of our wave -ii- correction.
If wave -i- ended at 1187.20 then we should be expecting a 50 to 61.8% retracement of the wave -i- rally, which would be 1164.65 and 1159.30, respectively.
As a minimum, we should trade below 1179.70, to end either wave -ii- or an extended wave .ii. of -v-. Wave .i. would have ended at Friday’s high of 1187.20.
Note that a test of the red down trend line is likely….
Long term chart:
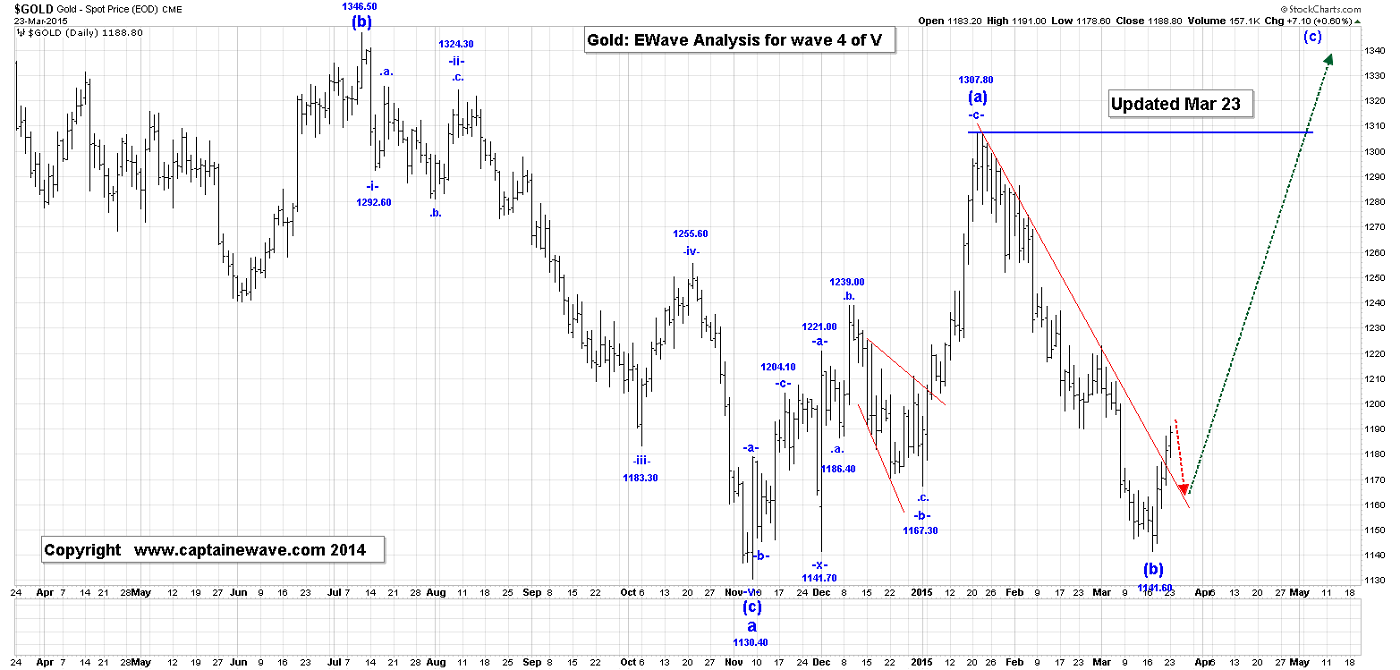
We believe gold can rise to at least $1307, and more likely to $1425, just as this C wave advance really gets underway!
We are long 13 COMEX long positions, risking to $1142!
Crude
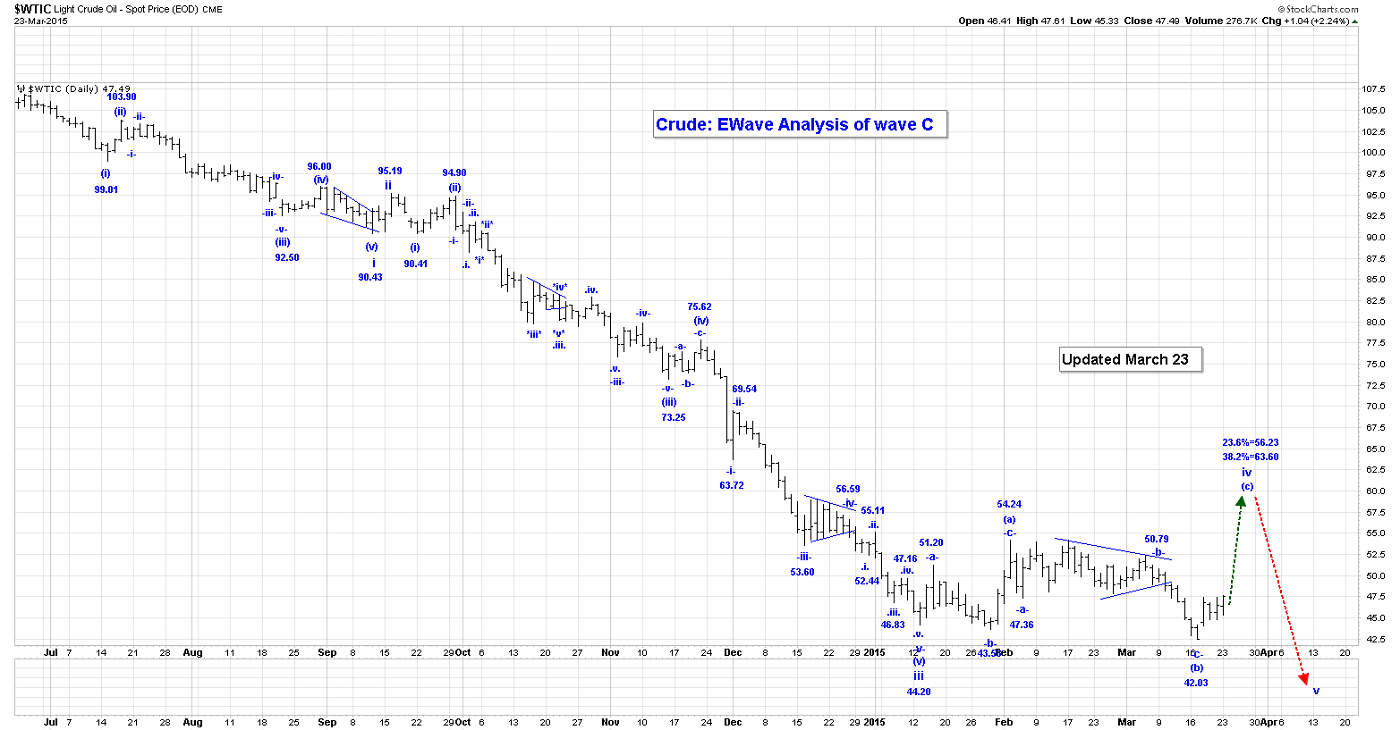
Crude was higher in today’s day session reaching 47.60, at the time that this Post was being written.
We also traded above the double top at 47.30/47.40. Evidence is building very nicely that we are well underway in our expected wave (c) of iv rally.
Based on today’s trading we are sticking with our current thinking for how wave (c) is developing, as follows:
-i- = 47.47;
-ii- = 44.83;
-iii-:
.i. = 47.33;
.ii. = 45.34. Note that the 78.6% retracement of wave .i. = 45.37!
.iii. rally is now.
Projections for the end of wave .iii. are:
.iii. = 1.618.i. = 49.39;
.iii. = 2.618.i. = 51.89.
Some projections for the end of wave -iii-:
-iii- = 1.618-i- = 50.40;
-iii- = 2.618-i- = 53.85.
We have raised out stop to 44.76
We are long 8 positions risking to 44.76.
S&P500: 120 Min S&P500 Chart:
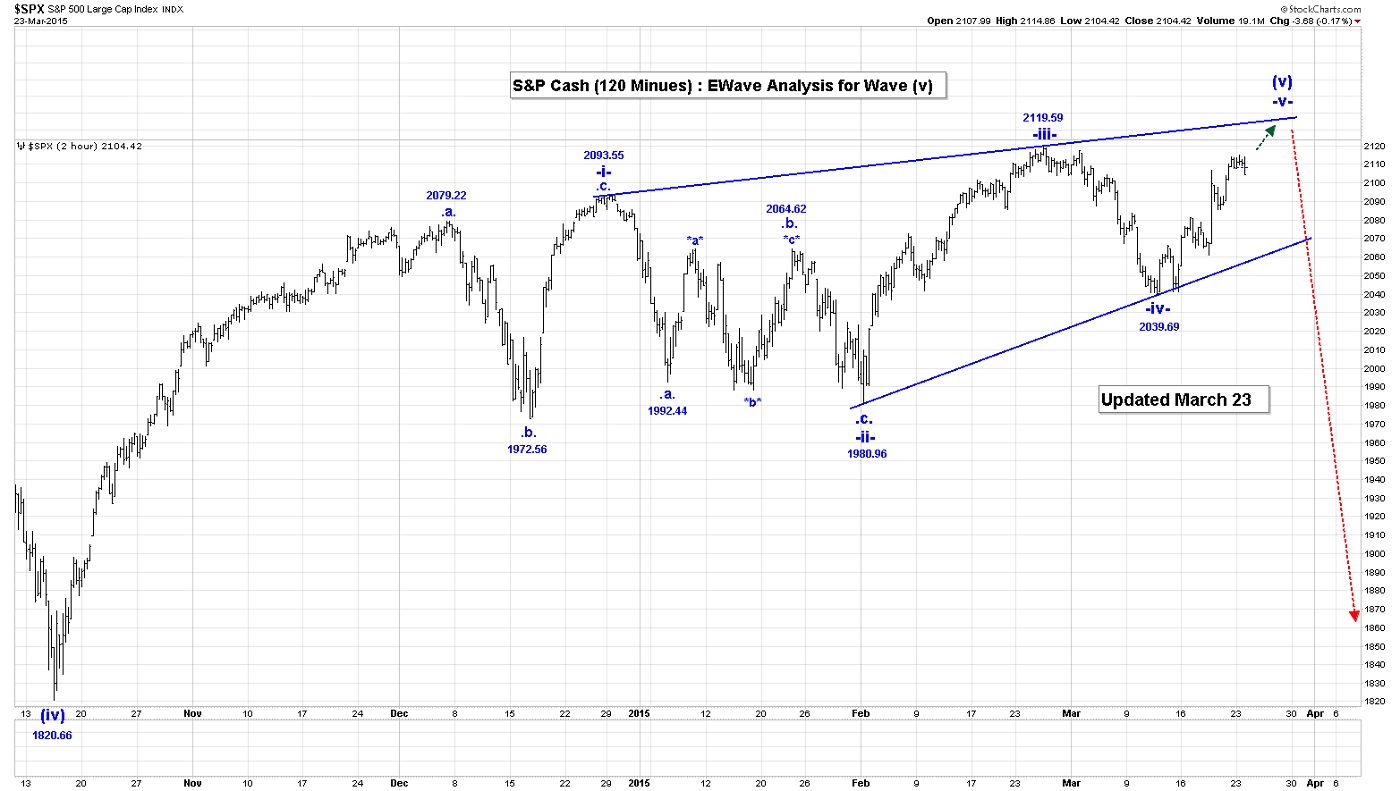
The S&P500 was very stable today. As you can see on the attached 120 Min S&P Chart, we still need to at least trade to the wave -iii- high of 2119.59, to satisfy the minimum conditions for a completed ending diagonal triangle.
We will probably start probing the short side on a trade above the 2119.59 high.
USDX: Daily chart
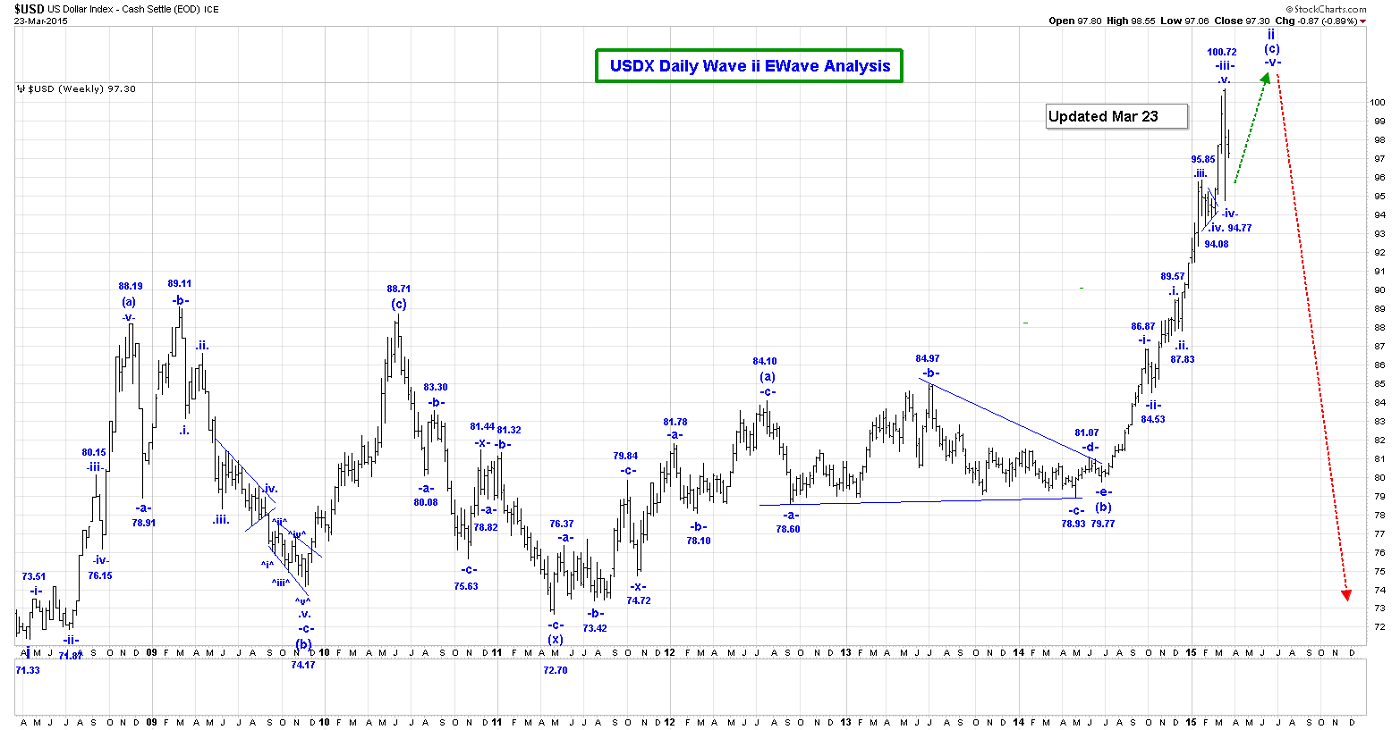
It appears that our low of 94.88 was correct as the futures market did experience liquidity problems, which probably created the difference between the cash and future markets.
We use the cash market, so we will be basing our analysis on the 94.88 low.
In today’s day session the USDX reached a low of 97.07 at the time that this post was being written.
It is not clear whether this is the end of wave .c. of our wave -iv- triangle, or whether we have further to fall. We can drop all the way down to the wave .a. low of 94.88, before our triangle formation would need to be eliminated. We updated the current progress of our wave -iv- triangle, based on today’s trading below:
.a..b.= 99.76;
.c. = 97.07, if complete;
Waves .d. and .e. to go to complete all of wave iv- triangle.
Upon completion of wave -iv we need to rally one more time in wave -v- to at least the wave -iii- high of 101.71. A break now of 94.88, would suggest something different is happening.
NG
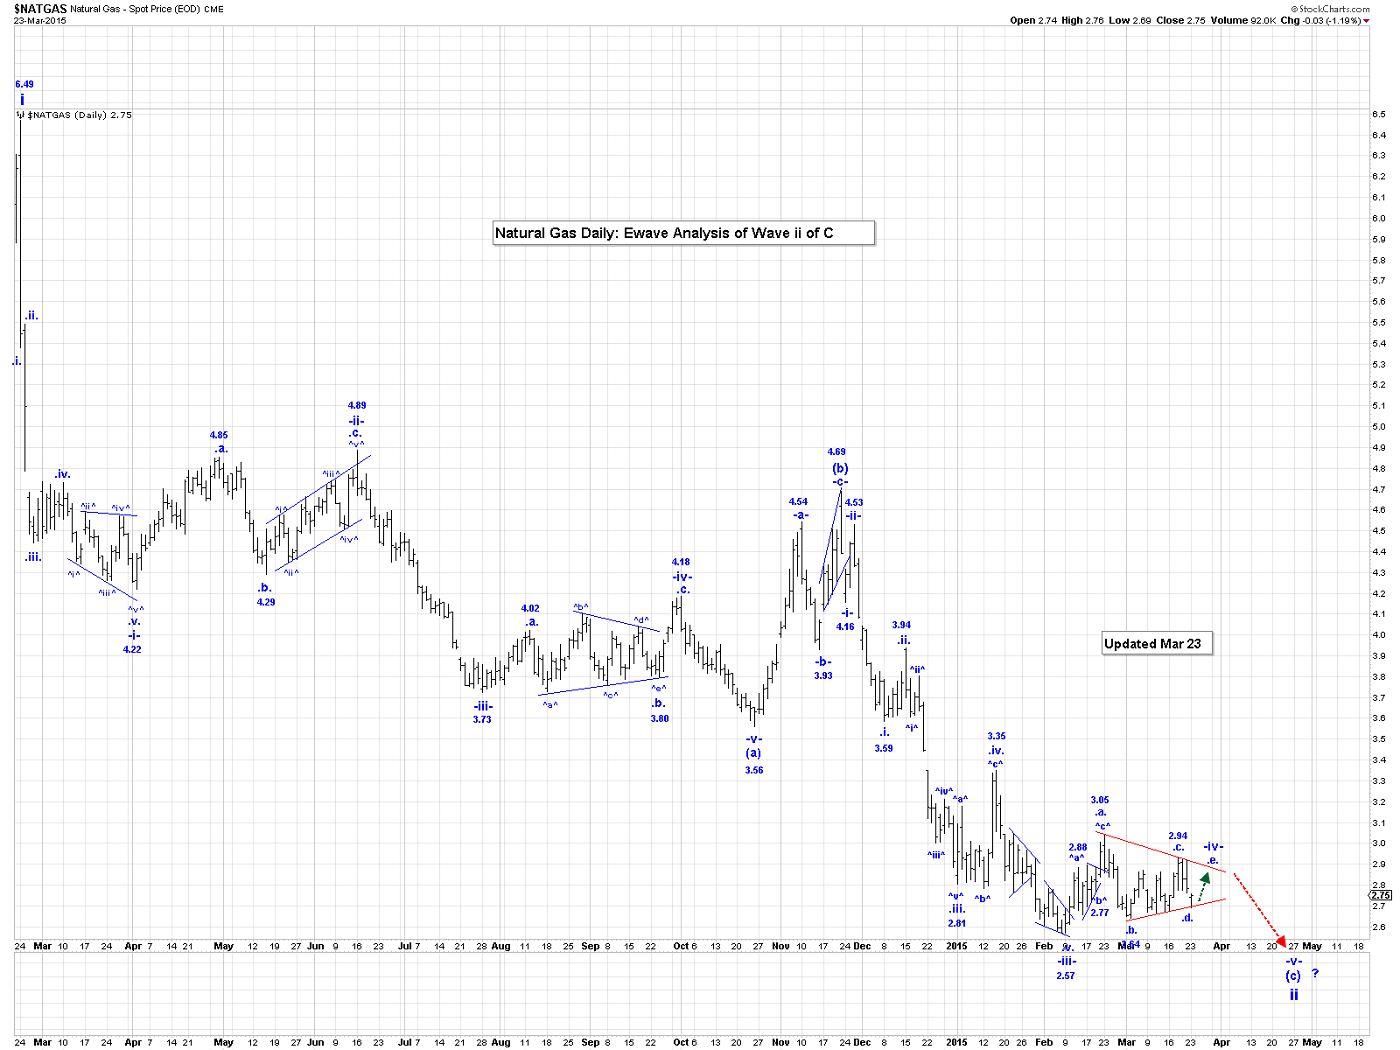
NG dropped a little below 2.72 in today’s day session. We have satisfied the minimum requirements for a completed wave .d., so we cannot rule the possibility that our wave .e. rally has now begun.
We do have a projection for the end of wave ^c^ at 2.66. For our triangle formation to remain valid we cannot trade below the wave .b. low of 2.64. Upon completion of wave .d., we should rally one more time in wave .e. to complete the entire wave -v- triangle. And then….boom, boom, out go the lights!
HUI/GDX
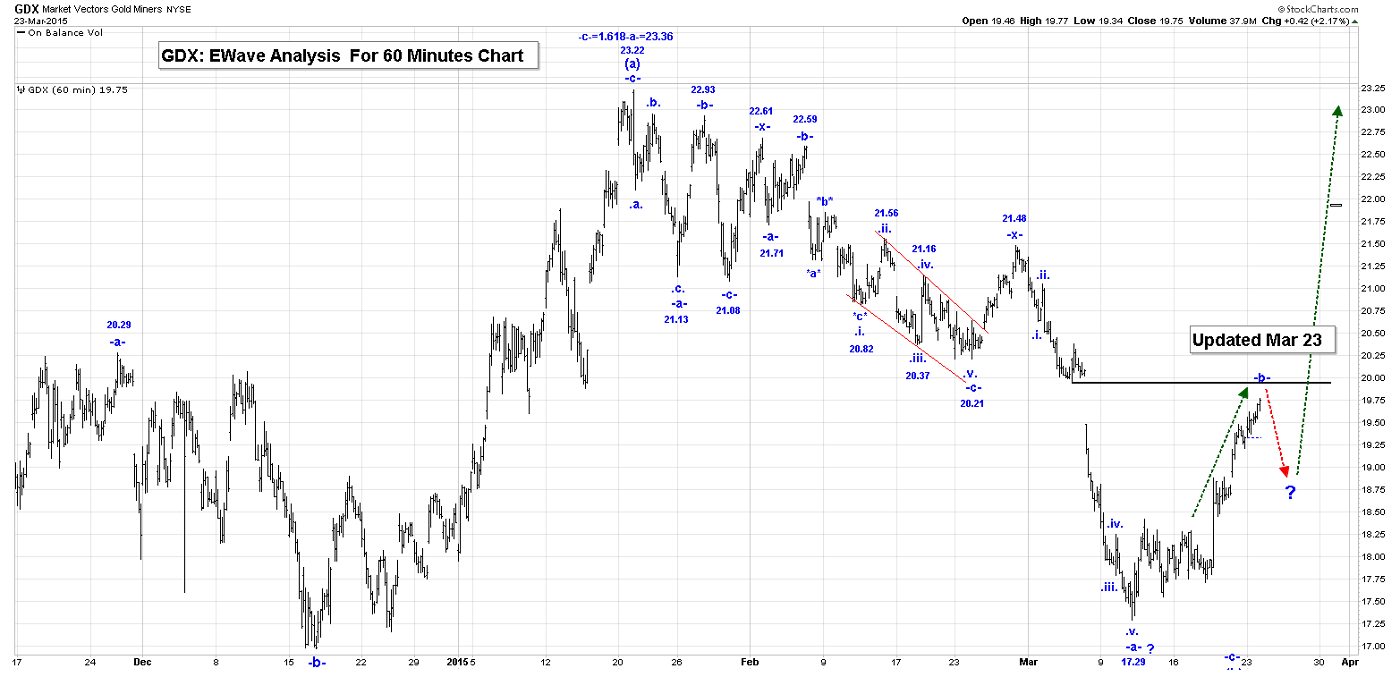
The HUI/GDX continued higher with gold today.
We are long the GDX, risking to 17.29.
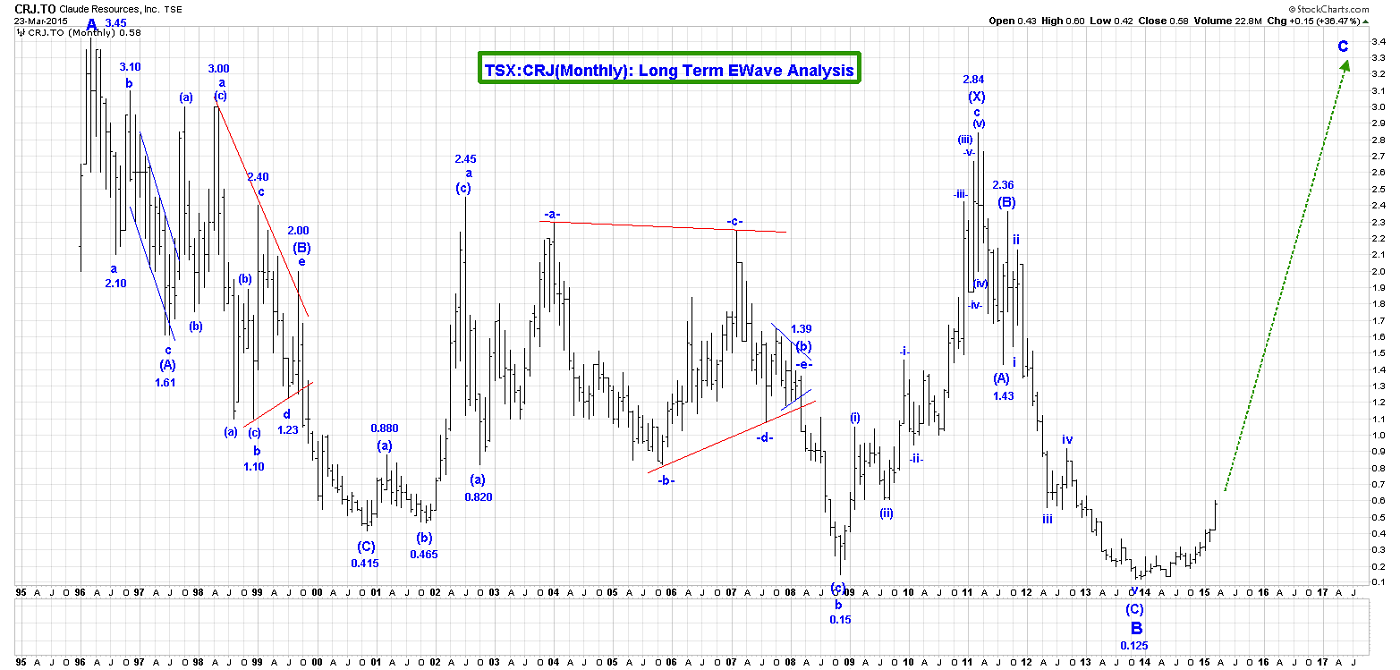
Here’s a look at junior gold sector bellwether Claude Resources:
Here’s a look at industry bellwether Barrick:

While gold could pull back to the $1159 - $1165 area, Barrick seems poised to stage an upside Wave C breakout anyways!
********
Email: [email protected]
Website: www.captainewave.com
Risk: CAPTAINEWAVE.COM IS AN IMPERSONAL ADVISORY SERVICE. AND THEREFORE, NO CONSIDERATION CAN OR IS MADE TOWARD YOUR FINANCIAL CIRCUMSTANCES. ALL MATERIAL PRESENTED WITHIN CAPTAINEWAVE.COM IS NOT TO BE REGARDED AS INVESTMENT ADVICE, BUT FOR GENERAL INFORMATIONAL PURPOSES ONLY. TRADING STOCKS DOES INVOLVE RISK, SO CAUTION MUST ALWAYS BE UTILIZED. WE CANNOT GUARANTEE PROFITS OR FREEDOM FROM LOSS. YOU ASSUME THE ENTIRE COST AND RISK OF ANY TRADING YOU CHOOSE TO UNDERTAKE. YOU ALSO AGREE TO BEAR COMPLETE RESPONSIBILITY FOR YOUR INVESTMENT RESEARCH AND DECISIONS AND ACKNOWLEDGE THAT CAPTAINEWAVE.COM HAS NOT AND WILL NOT MAKE ANY SPECIFIC RECOMMENDATIONS OR GIVE ADVICE TO YOU OR ANY OF ITS CLIENTS UPON WHICH THEY SHOULD RELY. CAPTAINEWAVE.COM SUGGESTS THAT THE CLIENT/MEMBER TEST ALL INFORMATION AND TRADING METHODOLOGIES PROVIDED AT OUR SITE THROUGH PAPER TRADING OR SOME OTHER FORM OF TESTING. CAPTAINEWAVE.COM, ITS OWNERS, OR ITS REPRESENTATIVES ARE NOT REGISTERED AS SECURITIES BROKER-DEALERS OR INVESTMENT ADVISORS EITHER WITH THE U.S. SECURITIES AND EXCHANGE COMMISSION OR WITH ANY STATE SECURITIES REGULATORY AUTHORITY. WE RECOMMEND CONSULTING WITH A REGISTERED INVESTMENT ADVISOR, BROKER-DEALER, AND/OR FINANCIAL ADVISOR. IF YOU CHOOSE TO INVEST WITH OR WITHOUT SEEKING ADVICE FROM SUCH AN ADVISOR OR ENTITY, THEN ANY CONSEQUENCES RESULTING FROM YOUR INVESTMENTS ARE YOUR SOLE RESPONSIBILITY.
ALL INFORMATION POSTED IS BELIEVED TO COME FROM RELIABLE SOURCES. CAPTAINEWAVE.COM DOES NOT WARRANT THE ACCURACY, CORRECTNESS, OR COMPLETENESS OF INFORMATION AVAILABLE FROM ITS SERVICE AND THEREFORE WILL NOT BE LIABLE FOR ANY LOSS INCURRED. DUE TO THE ELECTRONIC NATURE OF THE INTERNET, THE CAPTAINEWAVE.COM WEBSITE, ITS E-MAIL & DISTRIBUTION SERVICES AND ANY OTHER SUCH "ALERTS" COULD FAIL AT ANY GIVEN TIME. CAPTAINEWAVE.COM WILL NOT BE RESPONSIBLE FOR UNAVAILABILITY OF USE OF ITS WEBSITE, NOR UNDELIVERED E-MAILS, OR "ALERTS" DUE TO INTERNET BANDWIDTH PROBLEMS, EQUIPMENT FAILURE, OR ACTS OF GOD. CAPTAINEWAVE.COM DOES NOT WARRANT THAT THE TRANSMISSION OF E-MAILS, OR ANY "ALERT" WILL BE UNINTERRUPTED OR ERROR-FREE. CAPTAINEWAVE.COM WILL NOT BE LIABLE FOR THE ACTS OR OMISSIONS OF ANY THIRD PARTY WITH REGARDS TO CAPTAINEWAVE.COM DELAY OR NON-DELIVERY OF THE CAPTAINEWAVE.COM NIGHTLY EMAILS OR "ALERTS". FURTHER, WE DO NOT RECEIVE ANY FORM OF PAYMENT OR OTHER COMPENSATION FOR PUBLISHING INFORMATION, NEWS, RESEARCH OR ANY OTHER MATERIAL CONCERNING ANY SECURITIES ON OUR SITE OR PUBLISH ANY INFORMATION ON OUR SITE THAT IS INTENDED TO AFFECT OR INFLUENCE THE VALUE OF SECURITIES.
THERE IS NO GUARANTEE PAST PERFORMANCE WILL BE INDICATIVE OF FUTURE RESULTS. NO ASSURANCE CAN BE GIVEN THAT THE RECOMMENDATIONS OF CAPTAINEWAVE.COM WILL BE PROFITABLE OR WILL NOT BE SUBJECT TO LOSSES. ALL CLIENTS SHOULD UNDERSTAND THAT THE RESULTS OF A PARTICULAR PERIOD WILL NOT NECESSARILY BE INDICATIVE OF RESULTS IN FUTURE PERIODS. THE RESULTS LISTED AT THIS WEBSITE ARE BASED ON HYPOTHETICAL TRADES. PLAINLY SPEAKING, THESE TRADES WERE NOT ACTUALLY EXECUTED. HYPOTHETICAL OR SIMULATED PERFORMANCE RESULTS HAVE CERTAIN INHERENT LIMITATIONS. UNLIKE AN ACTUAL PERFORMANCE RECORD, SIMULATED TRADES DO NOT REPRESENT ACTUAL TRADING. ALSO, SINCE THE TRADES HAVE NOT ACTUALLY BEEN EXECUTED, THE RESULTS MAY HAVE OVER OR UNDER COMPENSATED FOR THE IMPACT, IF ANY, OF CERTAIN MARKET FACTORS SUCH AS LACK OF LIQUIDITY. YOU MAY HAVE DONE BETTER OR WORSE THAN THE RESULTS PORTRAYED. NO REPRESENTATION IS BEING MADE THAT ANY ACCOUNT WILL OR IS LIKELY TO ACHIEVE PROFITS OR LOSSES SIMILAR TO THOSE SHOWN. NO INDEPENDENT PARTY HAS AUDITED THE HYPOTHETICAL PERFORMANCE CONTAINED AT THIS WEBSITE, NOR HAS ANY INDEPENDENT PARTY UNDERTAKEN TO CONFIRM THAT THEY REFLECT THE TRADING METHOD UNDER THE ASSUMPTIONS OR CONDITIONS SPECIFIED HEREAFTER. WHILE THE RESULTS PRESENTED AT THIS WEBSITE ARE BASED UPON CERTAIN ASSUMPTIONS BELIEVED TO REFLECT ACTUAL TRADING CONDITIONS, THESE ASSUMPTIONS MAY NOT INCLUDE ALL VARIABLES THAT WILL AFFECT, OR HAVE IN THE PAST AFFECTED, THE EXECUTION OF TRADES INDICATED BY CAPTAINEWAVE.COM. THE HYPOTHETICAL RESULTS ON THIS WEBSITE ARE BASED ON THE ASSUMPTION THAT THE CLIENT BUY AND SELLS THE POSITIONS AT THE OPEN PRICE OF THE STOCK. THE SIMULATION ASSUMES PURCHASE AND SALE PRICES BELIEVED TO BE ATTAINABLE. IN ACTUAL TRADING, PRICES RECEIVED MAY OR MAY NOT BE THE SAME AS THE ASSUMED ORDER PRICES.
More from Gold-Eagle


