The Empire Strikes Back


It has been mentioned that the Commercials have developed a short position in the gold and silver that was becoming very precarious. Their only way out is to mount a major bear raid to force prices low enough to have longs close enough positions to enable the Commercials to reduce their net short position to acceptable proportions – which clearly was the objective of their actions the past week, as reflected in the heading. Time will tell whether they will achieve sufficient success, which I doubt; at least on the evidence so far.
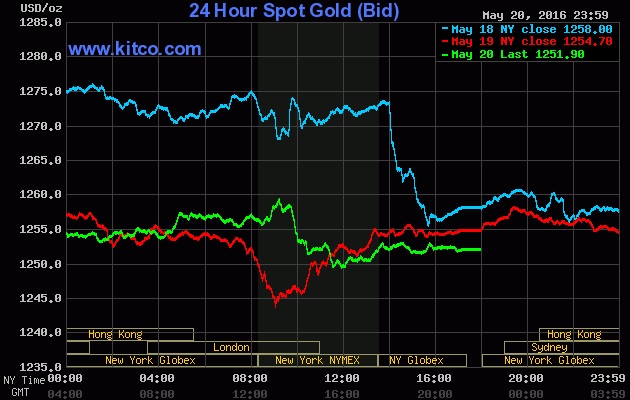
Repeated waterfalls during Thursday and Friday accentuated the weakness already present earlier last week. On Monday, the gold PM fix was $1285.75; on Thursday it was $1246.25, for a decline of 31%. Silver was fixed at $17.32 on Monday and on Thursday the low fix for the week was $16.60, for a decline of 4.2%.
The attack was blatant and sustained since Wednesday afternoon; but did they get as much advantage from it as they had hoped? Very importantly, did the raid shake loose enough longs to make up for the additional shorts the Commercials had taken on to conduct the raid as well as all the damage to Comex credibility? Keep in mind, when a long closes out his position to take profit, thereby removing a short position from the Commercial portfolio, should that position then be rolled over into a later contract, or a new position be opened when the price had stabilised, the net gain to the Commercials is really very small, except for some improvement in the average price of their total short position.
However, that gain on the average disappears when the long now uses all the profit made on the initial trade to add even more contracts to his long position. When the longs do so, knowing that the bull market in the metals has just started and time is on their side, the Commercials have an even heavier albatross around their necks.
If a gold bull closed a June contract as there is now too little time left for the price to recover before the contract expires, and then rolled his position over into August or a December contract, the Commercials later might be a lot worse than they are at the moment. In the light of such considerations, the changes in Comex gold open positions from the previous day for Thursday and Friday set an interesting stage:
|
Date |
June |
August |
December |
Total |
|
19 May |
-38399 |
+11567 |
+9028 |
-17504 |
|
20 May |
-31179 |
+16863 |
+221 |
-13632 |
In the COT of 17 May, the Commercials had 595 077 open positions; their net short position was 290 243. According to the table, 69578 June contracts were closed on those two days. New open positions in August or December, some of which possibly are rolled over, amount to 37 679; other, less important months added about 700 net new positions for a total of new open positions of just more than 38 000.
The decrease in the total number of open positions in gold, from Tuesday to Friday, is 35 513. Should this be the number of short positions the Commercials managed to close last week, they have moved a little back from the brink where they stood, but it is still a long way before they can breathe safely. Keep in mind their net short position in early December 2015 – just about 6 months ago – was only a paltry 2900 contracts or so, rising rapidly to just short of net 600 000 short a few days ago! If the bull trend is to resume, so too will the rising trend in open positions should the Commercials continue to intervene as they have done so far in 2016.
On the one hand, the results so far indicate the Commercials have to continue the raid into this week; they have little choice? However, if the trend visible in the table above from just two days continues into this week, extending the raid could be an example of real brinkmanship, skirting the edge of disaster. All four the fields show improvement from Thursday to Friday, with the gain of 17,504 positions that were closed on Thursday reduced to 13,632 on Friday, before the weekend. With the net short of the Commercials still of the order of 250,000 gold contracts at best, they are still hovering on the brink of potential disaster and be worse off should the bull trend resume. As always, time will tell.
It is a good thing to be flexible in one’s view of the world and in particular when the subject is one’s expectations of what should happen. Some weeks and months ago, there was lots of expectations that the DJIA would breach the 18,000 level again to bring happiness and contentment to the man on the street. A sustained attempt to make it that high during 2016 managed to just hold that level for a few days, back in April. More recent behaviour seems more like the start of a bear trend than being a new challenge on 18,000 level. Now the popular media has become silent on the DJIA and 18,000, but they gleefully point out all is well in the world as long as the S&P500 Index remains above 2000. Really flexible, that is. Could a next benchmark for the economic health of the US be that the Nasdaq should hold above 4000?
With the yield on the 10-year Treasury note jumping back into its bear channel and the DJIA just breaking lower from its steep bull channel, there is a bearish outlook on two major markets, should these two extend their new trends this week. While the firm dollar held steady through the week, helped by crude. it cannot perform a miracle on its own. The overall view ahead is of teeth and nails, not of horns.
Euro-Dollar
The euro is continuing its ‘zig-zag’ rising trend, having extended the ‘Zag’ to close lower than the previous week. The overall trend is assumed still to be intact while holding in bull channel KL ($1.1118); breaks above lines K ($1.1668), P ($1.1734) and C ($1.1786) are needed to be clear of nearby resistance. The euro is still a long way below its earlier volatile sideways trading band, before its sustained bear trend after a break below the support of line I. For the moment, though, the focus has to remain on channel KL.

Euro-dollar, last = $1.1223 (www.investing.com)
Dow Jones Industrial Average (DJIA)
The still marginal break below steep bull channel KL (17845) and also lower, below the support of line P (17567), could mean that the battle to regain the level of 18 000 is over. However, given the very steep spike recoveries made by the DJIA as soon as its outlook turns bearish, it would be premature to take a new bear market for granted. On the breaks from channel KL and below support at line P, the DJIA now has a bearish bias, at least while the two breaks hold. Should there be a clear break below the shallower bull channel XMY (16903), it would be first confirmation that the bear is showing it has really sharp claws, with second confirmation to come with a break below channel BC (15934).

Dow Jones Industrial Index, last = 17501 (money.cnn.com)
Gold PM fix - Dollars
The past week was not very kind for gold. The desperation raid on the price brought a break below the support of bull channel KL ($1285) that has set a new sideways to bearish trend to the price following its rising trend off line R ($1040), which had stalled at resistance at line Q ($1296). Line C also offers resistance at $1277 before the bull trend can resume.
The preferred gradients the trend lines attempt to identify are not impenetrable for brief moments. There are conditions when a price will break briefly through such a trend line, only to recover within a short while, rarely longer than only a few time periods. On the other hand, except for its run higher to the 2011 top, glancing at the chart shows that gold seems to have found the steep gradient of channel JKL difficult to sustain.
The break below channel KL could be a sideways move to establish a shallower bull channel in due course. Given the fundamentals, the odds that the break below the steep support is the start of a major new bear trend appear to be rather low.
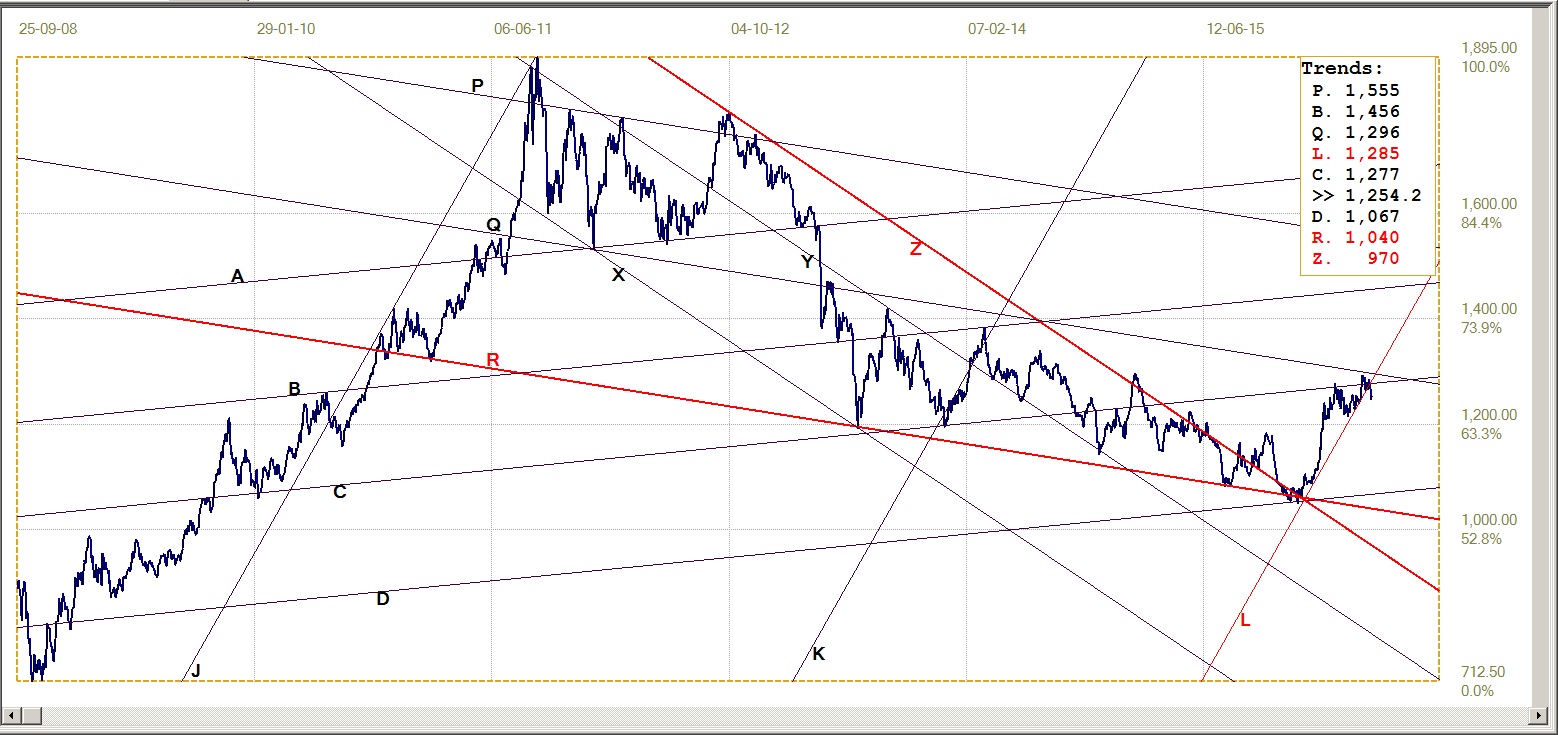
Gold price – London PM fix, last = $1254.20 (www.kitco.com)
Gold PM fix - Euro
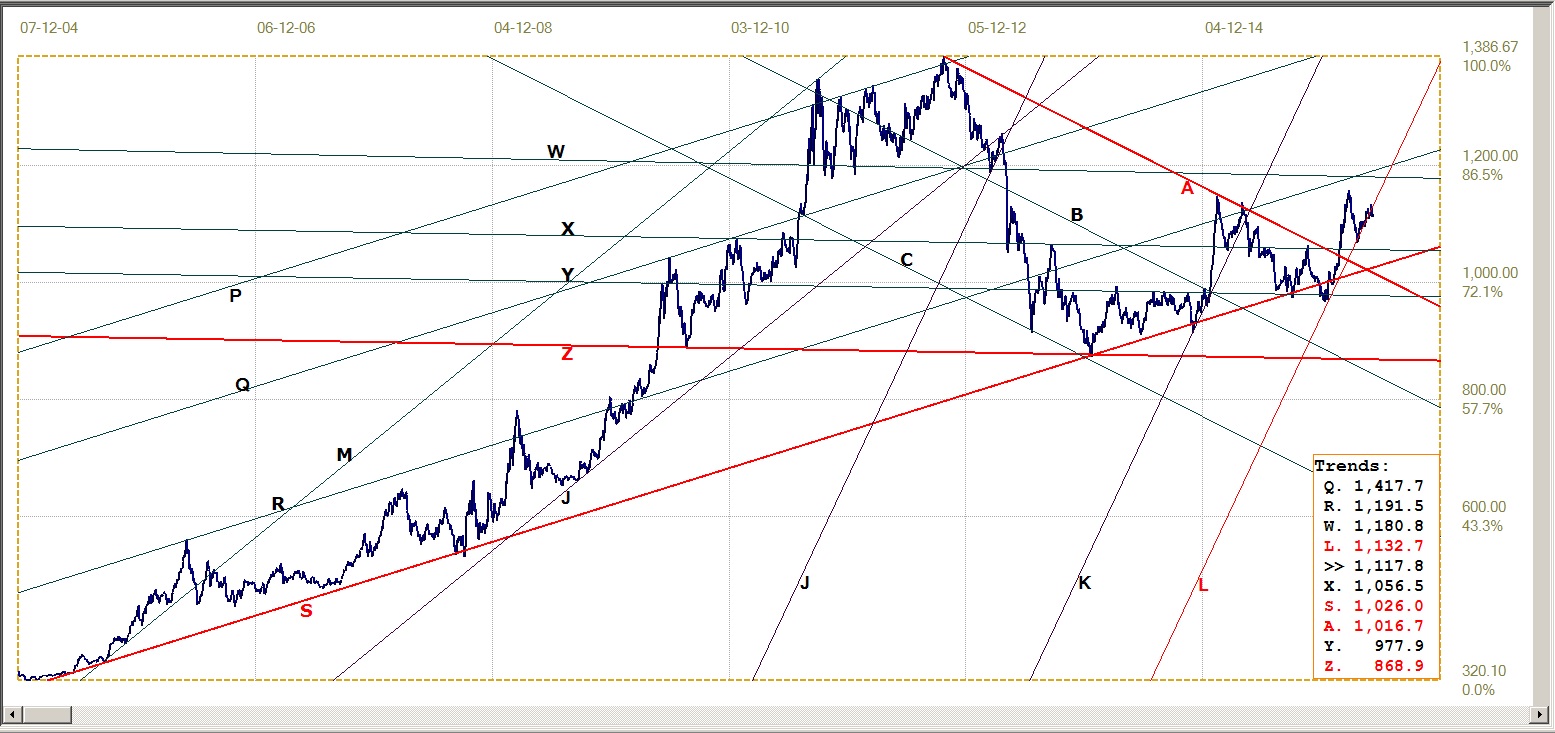
Euro gold price – PM fix in Euro, last = €1117.8 (www.kitco.com)
The euro was again weaker last week, which to some degree compensated for the suffering price of gold. The compensation was however not enough to keep gold in euro’s in its own steep bull channel, KL (€1133). The still marginal break below the channel could reverse back above line L to leave a small false break behind; on the other hand, the same observation made for the dollar price of gold ) may apply, that the gradient of channel KL is too steep to be sustained and the price is now looking to establish a shallower bull channel.
There is no reason to think that the bull trend in gold – and in silver – is over after just one strong bear raid. The high open interest shows how much effort – and the large amount of funds – have gone into trying to keep a tight rein on the prices of the metals. Sentiment has changed; for now one could guess that the permanent gold bulls have raided their piggy banks to get into the new bull market as close to the ground floor as they could. General sentiment still has to accept the almost 5 year bear market is over and a new bull is flaunting its still small horns. When that happens, it will put the cat among the pigeons – to really play mixed metaphors!
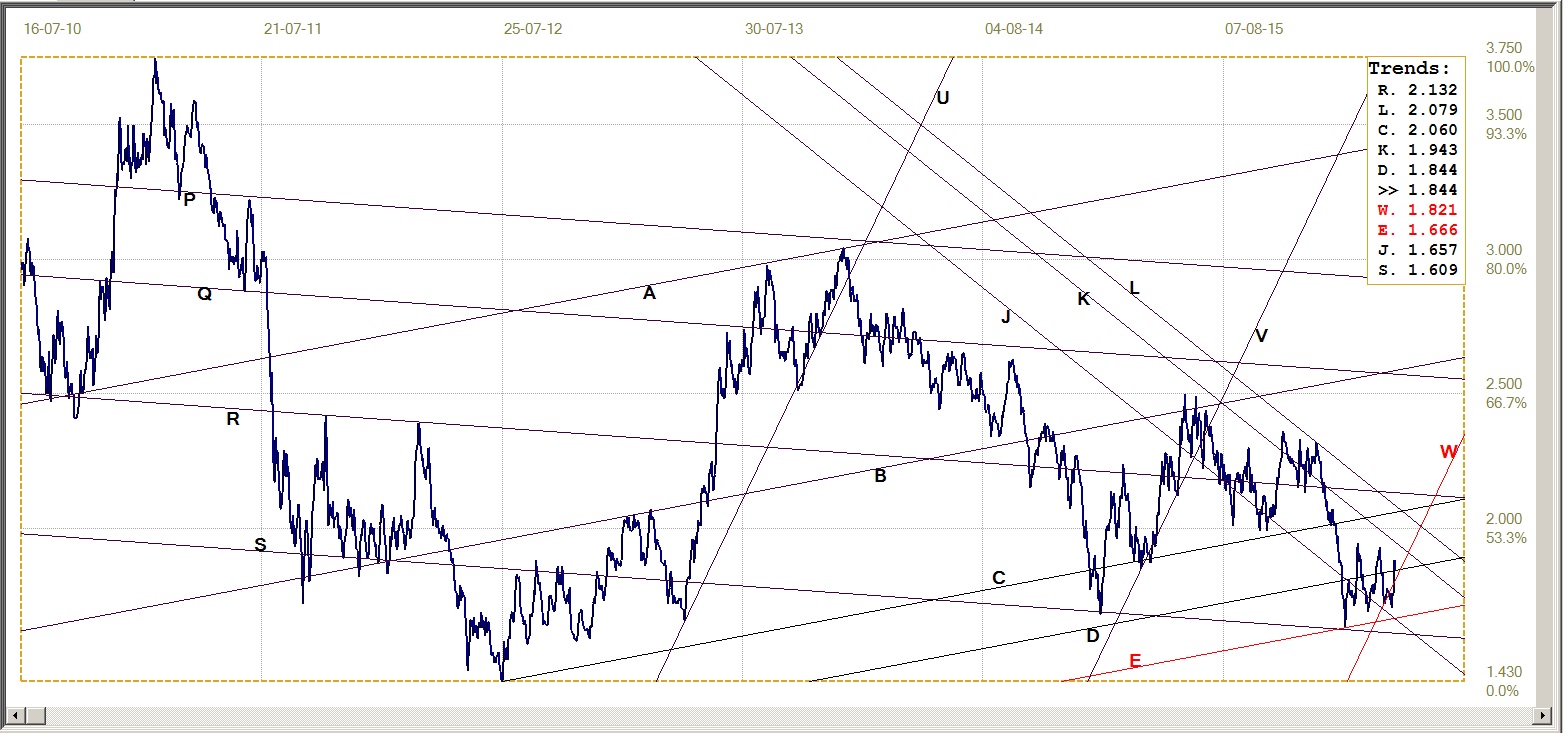
Silver Daily Fix Chart

Silver daily fix, last = $16.65 (www.kitco.com)
For quite a long time, silver has acted in a way that suggested the Cartel viewed it as the greater risk than gold. It seemed as if attacks on gold were used to depress the price of silver, while silver tended to show more resilience than gold to these attacks. In a technical sense, this has may have happened again during the current raid on the metals; whereas the price of gold in dollars has broken clear below its bull channel, the dollar price of silver has done so only marginally, holding close to the support of the three trend lines, R ($16.76), D ($16.83) and L ($17.00). This observation relies on a slight improvement in the silver fix, from $16.60 to $16.65 on a Friday, with a history of weaker metal price just before a weekend.
The move and a similar near $8 dollar jump in the gold PM fix before the weekend, combined with the improved bullish sentiment on Comex, as seen from the table in the introduction, present some evidence that the raid might be over. It all depends on whether the Commercials, given what seems the disappointing results from their raid, are determined to continue with it despite the possibility that by doing so they can find themselves in an even worse situation than before.
US 10-year Treasury Note
US 10-year Treasury note, last = 1.844% (www.investing.com)
Last week it was speculated that the sudden recovery in the bond market that took the yield on the 10-year Treasury note clear below bear channel VW (1.821%) may imply a similar mechanism to that sudden recoveries in the DJIA! While it would not surprise should it be found to apply, the new weakness in the bond market that has the yield back in bear channel VW parallels a weaker Wall Street.
The break higher above the market support at line D (1.844%) was also penetrated to signal a bearish trend, but it failed to extend. A slight recovery from the bearish high saw the yield pulling back to rest right on top of the market resistance of line D. Quite frequently, a break through a prominent trend line briefly reverses trend to just touch the trend back before resuming the previous trend; a manoeuvre that is known as a ‘goodbye kiss’. It is possible this is what is happening here.
West Texas Intermediate Crude. Daily close
The new bull trend in WTI crude is still holding well clear of the steep support along line W ($43.92). Some commentators are finding the rally in crude more than just a little mystifying. Increasing uncertainty about a production freeze by the producers in the mid-east and also Russia, with Iran still trying hard to increase its output in an attempt to improve foreign revenues, as well as mounting global reserves, one would have expected for the price of crude to be under some selling pressure.
The once apparent link between the DJIA and the price of crude has not been in place during the past week or so; with the DJIA edging lower, but the price of crude ticks higher. Can it be that the price of crude is being levitated in an attempt to influence Wall Street to also turn bullish in the hope that the potential crisis among shale oil producers will be defused, at least to some degree. In terms of what has become a norm in so many other markets, this is possibility is not so farfetched.

WTI crude – Daily close, last = $48.45 (Investing.com)
©2016 daan joubert, Rights Reserved
chartsym (at) gmail(dot)com
More from Gold-Eagle


