Falling Discount, Gold And Silver Get ‘Powelled’


Warren Buffet famously proposed the analogy of a machine that produces one dollar per year in perpetuity. He asks how much would you pay for this machine? Clearly it is worth something more than $1.00. And it’s equally clear that it’s not worth $1,000. The value is somewhere in between. But where?
This leads to the concept of discount (which we mentioned in Falling Productivity of Debt two weeks ago). A dollar to be paid next year is worth less than a dollar in the hand today. One reason is that we are mortal beings. In order to be alive next year, we must remain alive every single day between now and then. There are natural reasons for time preference—the desire to have a good today, and not postpone it. We are also not omniscient. Something may come up, such as an illness, which forces us to consume what we did not plan to consume.
Another reason is, of course, risk. Unlike the magic machine in our example, a business enterprise may cease to make money for any number reasons including a new competitor or changing customer preferences.
For many reasons, a dollar to be paid next year is not worth a dollar today. A dollar to be paid in ten years is worth even less. Future payments must be discounted. The discount is related to the interest rate, and it shares many of the same causes.
It can be quoted as a yield, if you look at earnings divided by share price. We aren’t going to go through the formula to discount future earnings into perpetuity here. However, the math works out. The current P/E ratio of S&P 500 stocks is 25.74. This is the same as saying the E/P ratio is 3.89%. If you discount a dollar of earnings every year into perpetuity, at 3.89%, you get 25.74. So we use discount rate and earnings yield equivalently, depending on context and the point we want to make.
The higher the price of the share, the lower the yield. With each halving of discount rate and hence earnings yield, the share price doubles. A nifty trick to create free money, eh? Just somehow lower rates and yields across the economy…
It should not be surprising that discount has been falling along with the interest rate. Let’s look at earnings yield again (ignoring dividend yield which is under the control of corporations, who have broad discretion to set the dividend, and hence not as clear a signal).
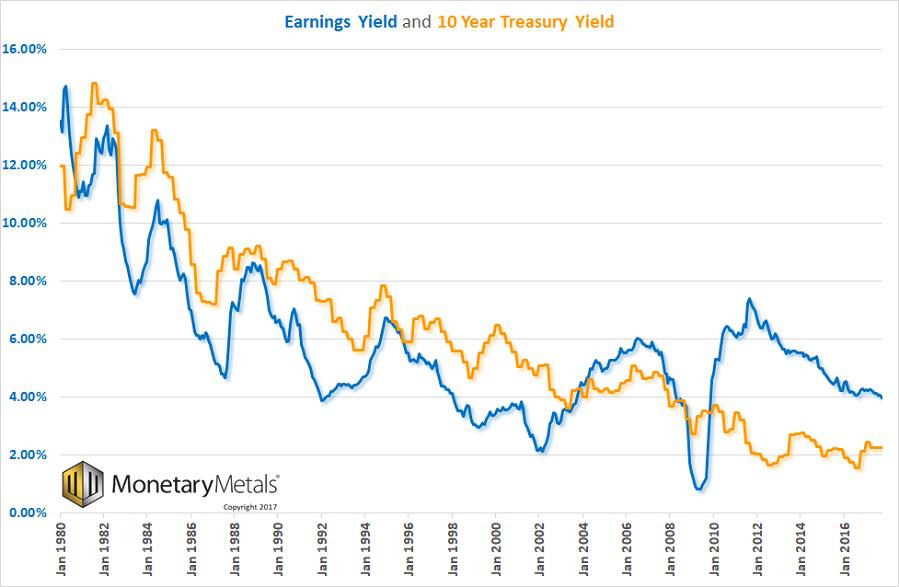
This chart is showing three things. First and most obvious, the earnings yield on stocks falls with the interest rate (as does marginal productivity of debt as we showed last week). And it makes sense, the more the Fed pushes down interest, then equities become more attractive. At least until their yields are pulled down closer to Treasury yields.
Second, yield purchasing power is falling. This is not how many groceries you could buy if you liquidate your stocks (as the mainstream view would have you think). It is how many groceries you can buy with the earnings of the businesses you own. Stocks are partial ownership of businesses, and as a shareholder you have a portion of the earnings. As yield purchasing power falls, it takes more and more capital to generate enough income to buy food. At the current level of 3.89%, if you need $50,000 a year to live, you need about $1.3 million worth of S&P shares.
And it’s actually worse than that. Corporations do not pay 100% of their profits to shareholders. At present, they pay out a bit under half of their profits. To live on the dividends, you would need about $2.7 million worth of shares. But as we noted above, equities incur significant risk that the business will become less profitable. Debt must be paid. Dividends are optional.
Third, and you probably saw this coming, discount is falling. The market price of that dollar of earnings way out in the futures, years away, is rising. It is saying that a dollar to be earned by the corporation in a decade, is worth over 67 cents today. And a dividend to be paid out in a decade is worth 83 cents.
I hardly think we would be alarmists or perma-bears to say that at such a low discount, investors have a razor thin margin of safety. This is without getting into the rising debt level to maintain even this profit. Nor the problem of borrowing to pay dividends.
We want to underscore one final point here. When the Fed pushes down interest rates, it manipulates discount and hence measurement of both time and risk. It is toying with powerful forces, which should not be toyed with. All the king’s horses and all the king’s men know little about the damage they wreak. They focus only on the rate at which consumer prices are rising, or perhaps GDP. Meanwhile, investors are forced to pretend that a bird 10 bushes away is worth almost as much as a bird in the hand.
We can only shake our heads again, and refer to the impotence of governments to repeal natural law with legislative law. We can only point to the example of King Canute. The tide did not roll back for his command, nor does time preference and discount bend to the will of King Fed.
We love to hate the expression “it’s not a problem until it’s a problem,” but it seems so apropos to the unsustainable trends of falling discount, rising corporate debt, and falling marginal productivity of debt.
The above, by the way, describes a process of consumption of capital. Of eating the seed corn (two processes, if you count corporate borrowing to pay dividends). With each new speculator buying shares at ever-higher prices, there is a transfer of wealth from the buyer to the seller. The seller receives it as income, and spends some of it. The sellers are consuming some of the buyers’ wealth. These buyers fork over their wealth in the expectation that new buyers will come along soon, and give them even more wealth.
This is also known as the wealth effect, without any apparent irony. The people it harms most, the owners of capital, seem to like it. The way a junkie seems to like heroin. It may be destroying him, but the euphoria blots out other considerations.
We will close with two separate thoughts about gold. These thoughts should be kept separate, as far too often proponents of buying gold (e.g. dealers) mix up monetary economics with the driver to buy the metal.
One, in a free market for money (aka gold standard), no one has the power to manipulate interest rates, hence asset prices, yield purchasing power, and discount rates. The time preference of the savers has real teeth. This is the principle virtue of the gold standard (not static consumer prices, aka inflation, which is neither possible nor desirable).
Two, the falling marginal productivity of debt and falling discount is pathological. If one wants to avoid (well, minimize) one’s exposure, then one buys gold. Not out of hopes of a higher price (and the same seed-corn eating process of speculation described above). But simply as the alternative to equities with too little discount, and bonds with too little interest.
---
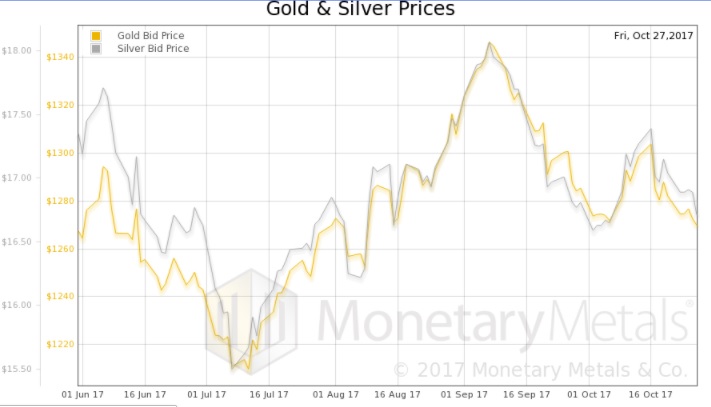
The prices of the metals dropped a bit more this week, -$7 and -$0.16.
We all know the dollar is going down, that it is the stated policy of the Federal Reserve to make it go down. We all know that gold has been valued for thousands of years. So why do we measure the timeless metal in terms of paper currency? It should be the other way around. We therefore encourage people to think of the price of the dollar measured in gold, rather than the price of gold measured in dollars.
This week, the dollar was up to 24.43 milligrams of gold.
On Friday, we had a curious thing. A report came out that Jerome Powell, who is on the Board of Governors of the Federal Reserve, is now the leading candidate to replace Janet Yellen as Chairman. This was deemed by the market to be good for gold and especially silver. Powell is not only an establishment guy, he has been part of the decision making body which has brought you the monetary policy which has caused/coincided with the drop in the price of gold from $1,558 when he took office.
Presumably the reason why he is a candidate, and the reason why the gold market bid up the price of gold, is that he will continue the current central plan. This plan could be charitably dubbed “monetary largesse”. Notwithstanding the theory held by both the mainstream Fed apologists and alternative Fed critics, this policy has not resulted in skyrocketing prices of either consumer goods or gold. But no matter, the likely appointment of the mainstream insider (as opposed to the other leading candidate, John Taylor, who is an academic and not a Fed official) is good news. For gold. For now.
Despite that this same policy over the last 6 years has caused /coincided with falling and more recently sideways or weakly rising gold price action, Powell is deemed good for gold. Speaking of more recent weak rising price action, we know technical traders who see the small size of this move as proof of another down leg to come in the price.
In the short term, of course, the price will bang about due to such Kremlinology. In the long term, equally of course, the price will change due to the fundamentals. That is what this Report is all about. We have invested in many years of research and development (and a license to a tick history database that contains every bid and offer with sub-millisecond resolution, going back to 1996). The output of our data science work are graphs showing the internal structure of the market, with unprecedented accuracy and clarity.
Below, we will discuss both the long-term big picture supply and demand fundamentals, and the intraday action around the Powell news. But first, here are the charts of the prices of gold and silver, and the gold-silver ratio.
Next, this is a graph of the gold price measured in silver, otherwise known as the gold to silver ratio. The ratio rose.

In this graph, we show both bid and offer prices for the gold-silver ratio. If you were to sell gold on the bid and buy silver at the ask, that is the lower bid price. Conversely, if you sold silver on the bid and bought gold at the offer, that is the higher offer price.
For each metal, we will look at a graph of the basis and cobasis overlaid with the price of the dollar in terms of the respective metal. It will make it easier to provide brief commentary. The dollar will be represented in green, the basis in blue and cobasis in red.
Here is the gold graph showing gold basis and cobasis with the price of the dollar in gold terms.

We see a rising cobasis (our measure of scarcity) along with a rising price of the dollar (i.e. falling price of gold, in dollar terms). This is not surprising; it is the typical pattern nowadays.
Our calculated Monetary Metals gold fundamental price fell $10 to $1,347.
Now let’s look at silver.
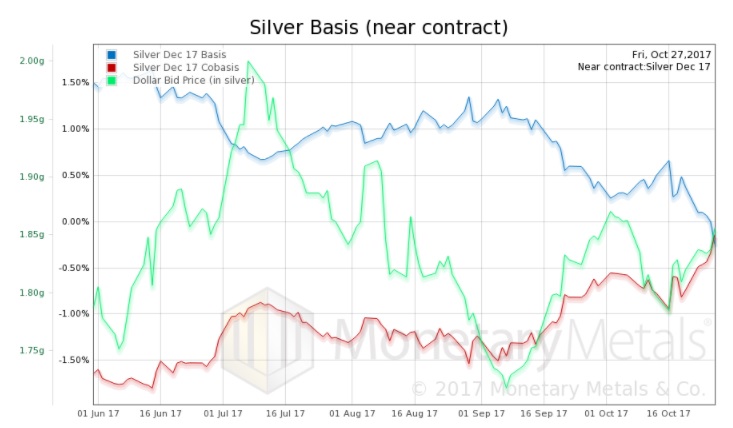
We also see a rising cobasis along with rising price of the dollar in silver terms (i.e. falling price of silver in dollar terms). Much of this rise is the mechanics of the contract roll, as traders start to sell the contract before expiry and buy the next month.
Our calculated Monetary Metals silver fundamental price fell $0.05 to $17.03.
Now, on to Friday’s “Powell Spike”. Somebody thought Powell would be good for gold. The price rallied four bucks in a minute, and then another three bucks within 8 minutes. But who? Was it stackers loading up on coins, prepping for inflatiocalypse? Or was it speculators loading up on leverage, betting on futures?
In Part II of this article, we answer this question by analyzing intraday graphs of the gold and silver basis.
© 2017 Monetary Metals
 Dr. Keith Weiner is the CEO of Monetary Metals and the president of the Gold Standard Institute USA. Keith is a leading authority in the areas of gold, money, and credit and has made important contributions to the development of trading techniques founded upon the analysis of bid-ask spreads. Keith is a sought after speaker and regularly writes on economics. He is an Objectivist, and has his PhD from the New Austrian School of Economics. His website is www.monetary-metals.com.


