The Fed Slams on The Brakes
With the mainstream financial press tossing around the word "inflation" like a hot potato, it is no wonder that the investing public has been deceived into thinking inflation (specifically, consumer price and wage inflation) is a factor which could have a considerable influence on our economy. But as with most news stories made for mass consumption, there is little in the way of truth behind these claims. In other words, the investing public has been conned once again.
There seems to be a tremendous misunderstanding surrounding the topic of inflation among today's financial press, politicians, investors and even banking administrators. Few can even define what the word means, much less how to truly recognize it. We are taught by economists to believe that inflation is a widespread increase in consumer prices, wages and the cost of living in general. In fact, these are but the manifest tokens of a certain kind of inflation, namely, commodities price inflation. Inflation in the truest sense is nothing more than an increase, in percentage terms, of the money supply. Did you get that? Most financial writers who have at least some inkling as to how to define inflation typically make the mistake of omitting that qualifier we placed in our definition. That is, that inflation represents an increase in the aggregate money supply in percentage terms—not in numerical terms.
Most financial writers who attempt to address this subject will simply take a chart or graph showing the never-ending increase in MZM money supply and pronounce this inflation. Indeed, a glance at any chart showing one or more of the various money supply measures is intimidating—it frequently is projected as a nearly vertical line reaching into infinity!
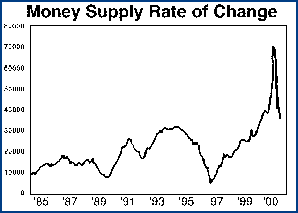
However, this is no proper way to go about measuring inflation or deflation within the economy. An accurate representation of the state of the money supply is measured by the rate of change in money supply—not in the money supply figures alone. In other words, to get the true sense for inflation, one must construct a momentum chart, which expresses the money supply in relation to the past. For instance, we consider the optimum measure of the rate of change (ROC) in the money supply to be a 10-month ROC chart. This is constructed by subtracting the money supply ten months ago from the present money supply figure. By taking a running total of this measurement and viewing it in the form of a line graph, one can actually see the waxing and waning of the money supply. There is no better way to take the pulse of inflation within an economy.
Notice the chart we have included here, labeled "Money Supply Rate of Change." It is 10-month ROC chart, seasonally adjusted and stretching back to 1985 and going forward to the present (the latest data being for March 2000). Note the huge run-up in inflation beginning in late 1998 and ending late last year. This is what has been primarily responsible for liquefying our financial markets and has no doubt been solely responsible for the bull market in U.S. stocks in recent years. However, whenever the Fed decides to slam on the monetary brakes by slowing down money creation (as manifested by the dips in the chart), the stock market—and even the economy itself—soon follow.

One very interesting thing to note is that a sudden slowdown in the money supply—like the kind we saw in 1987 and 1989—if done very suddenly, will anticipate a stock crash by approximately five months. This was the pattern we saw in 1987 and, more recently, this year (when the NASDAQ plunged earlier this month). Even more onerous is when the Federal Reserve decides to keep the monetary spigots running at extremely slow levels, thereby prolonging deflationary pressures, as they did in the late 1980s. This led directly to the recession of 1990-91. This chart should go a long way in graphically demonstrating that the Fed alone, through its ultimate control over credit and money creation, cause the business cycle. The Fed alone must bare the blame for creating stock market crashes and economic depressions. This was the pattern they adhered to in the late 1920s, the early 1970s, the late '80s/early '90s, and more recently, in late 1999/early 2000.
As it stands now, the Fed has raised interest rates five consecutive times and have expressed their intent to raise them again at its next interest rate meeting. Never has the interest rate been tampered with to such a large degree without producing massive convulsions.
The equities markets are running on nothing more substantial now than the still-heady optimism of the investing public—the Fed has been slamming on the monetary brakes for months now, with no sign of a letup on the horizon. This closely parallels the Fed policy of 1929 in the months preceding the Great Crash of October '29. It now appears all but certain we will share the same fate.
The bottom line is that it is not inflation that investors have to fear. Far from it. The specter we are faced with now is inflation's ugly cousin come to call—deflation. The masses of investors will soon get their first taste of what life without abundant credit is like. Are you prepared?


