Forecast: Gold Countertrend Correction, US Stocks Extending


Last week's trading saw the gold market forming its low in Monday's trading session, here doing so at the 1975.20 figure. From there, a sharp rally was seen into late-week, with the metal running all the way up to an early-Friday peak of 2089.20 - before giving way to a sharp correction off the same to end the week.
Gold, Short-Term
From the comments made in my last article, gold was looking for a series of minor corrections - the first of which we are now in, and coming from the 10-day time cycle:

In terms of time, the most recent phase of this 10-day wave was one of the most extended in past years, and with that was well overdue for its normal correction off the top. In terms of price, in our Gold Wave Trader report we noted the 2040.00 figure for the December contract as the downside reversal level for this wave - the number which would confirm its correction phase to be back in force.
With the above said and noted, the probabilities should favor additional weakness in the near-term, before setting up the next countertrend bottom for gold - prior to a resumption of the larger uptrend, which is expected to remain intact in the coming months, before any peak of real significance attempts to form.
Stepping back, until proven otherwise, the larger 34-day cycle is still seen as pointing higher, with that wave shown below:

If the above is correct, then the current correction phase with the 10-day cycle is favored to end up as countertrend, giving way to a marginally higher high on the next swing up - before topping the larger 34-day wave for its own correction phase into late-August or very early-September.
Technical Indications
Supporting the idea of a series of short-term corrections with the gold market is the current configuration of our Mid-Term Breadth index, which has recently turned south - off a divergent high - with that indicator shown on the chart below:
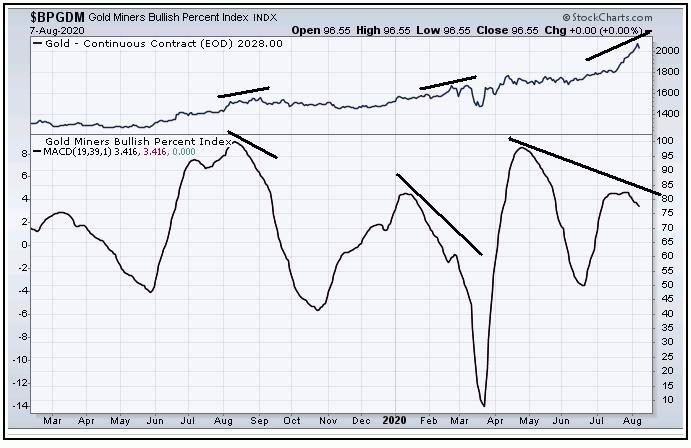
With the above said and noted, divergences in our mid-term breadth indicator and price are normally viewed as bearish - even though these divergences can carry on for some time, as was seen back in January - February of this year. However, the longer this divergence goes on the more bearish it eventually becomes, with the last such divergence giving way to the sharp decline seen into mid-March.
The Long-Term View
Even with gold anticipated to be in a series of corrections in the coming days/weeks, the larger trend is planted firmly to the upside, with a current four-year cycle target to the 2212.00 - 2340.56 region:
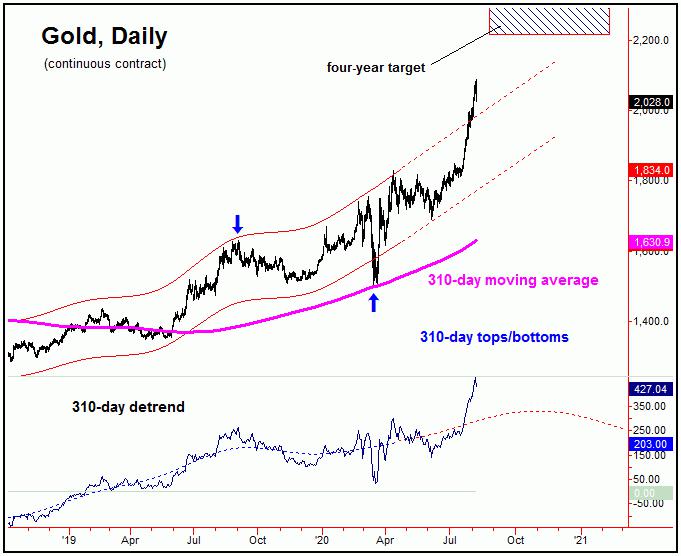
The above chart again shows the four-year target zone, which is overlaid with the smaller 310-day time cycle. This particular wave is deemed to be pointing higher well into later this year, where we would be looking for the next mid-term peak to form. However, the larger four-year wave (not shown) is projected higher into the late-2021 to early-2022 timeframe, which favors the next mid-term correction (with the 310-day component) to end up as countertrend.
U.S. Stock Market
As mentioned in recent weeks, the last correction of significance came from the 45-day cycle, which bottomed back in June of this year. The next decent correction phase is expected to come from this same wave - which is now at or into extended territory. Here again is that 34-day cycle:

In terms of time, our original bottoming window for this wave was projected for the mid-August timeframe or later, with the detrend now suggesting it will come closer to the latter-end of this range. More key for this wave is price, with our current downside ‘reversal point’ (the number which confirms this wave to have topped) set at the 3200.04 SPX CASH figure - though we expect this number to rise sharply in the coming days, with the latest numbers reported in our Market Turns outlook.
From the comments made in past articles, the larger 180 and 360-day cycles have been projected higher into the Autumn of this year. With that, the overall expectation is that any and all corrections with the SPX will end up as countertrend affairs, giving way to higher highs into that timeframe. Here is the larger 360-day cycle:
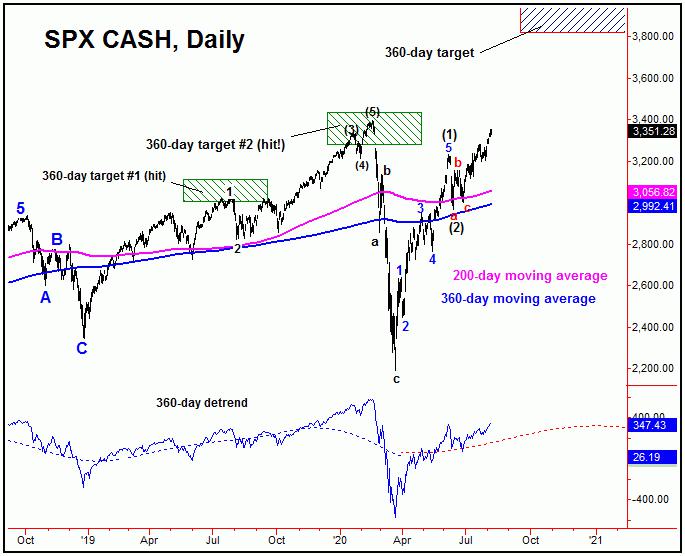
In terms of price, there is an open upside target with this 360-day cycle to the 3812.56 - 3960.44 SPX CASH region, and with that the assumption is that the index is headed up to that target zone in the coming months - before any larger-degree attempts to form. As can be seen on the above chart, the prior targets for this wave also acted as resistance levels - and with that we will keep a close eye on the accompanying action from technicals going forward, if and when this target range is met.
Jim Curry
The Gold Wave Trader
http://goldwavetrader.com/
http://cyclewave.homestead.com/


