Forecast: Gold Cycles Predicted The Rally, More To Come?


 Recap of Last Week
Last week's action saw the gold market forming its low in Tuesday's session, here doing so with the tag of the 1804.70 figure. From there, a decent rally back to higher highs for the move was seen into later in the week, here pushing all the way up to a Thursday high of 1848.50 - before backing off the same into Friday.
Gold's Short-Term View
As mentioned in recent articles, the last short-term bottom was expected to come from our 20-day cycle component, which is shown again on the chart below:
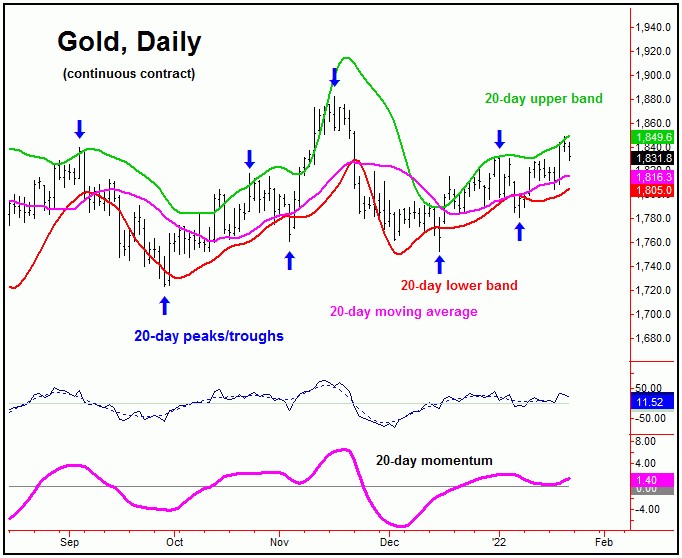
In terms of patterns, due to the configuration of the larger 72-day cycle (more on this in a bit), the probabilities favored each of the recent short-term pullbacks to end up as countertrend affairs - giving way to higher highs for the swing.
In terms of price, the minimum expectation called for a rally back above the 1833.00 swing top, though with the upper 20-day cycle band acting as a more ideal magnet. This assumption was easily met with the price action seen into late last week.
Stepping back slightly, the current short-term upward phase should end up topping our 20-day cycle once again, with this wave now at some 10 trading days along from its last labeled trough. In terms of price, the probabilities should favor another correction back to the 20-day moving average going forward, which is our normal magnet to the downward phases of this 20-day wave.
Gold Price 3-5 Week Picture
Going further with the above, there is at least some potential that the current upward phase of the 20-day cycle will end up topping our 72-day component, which is shown again on the chart below:
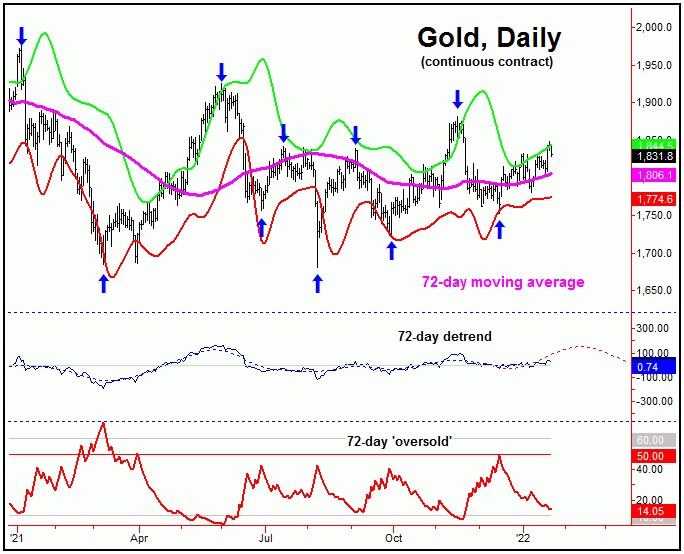
Having said the above, whether the current upward phase of the 20-day wave will end up peaking this bigger 72-day cycle is speculation at this point - and remains to be seen. More key is the coming correction with the smaller (20-day) component.
With the above said and noted, as long as any short-term decline with the 20-day cycle is able to remain above the 1780.00 figure on a daily close, then it could/should be the next upward phase of this 20-day wave (i.e., the one that follows the current rotation) that actually peaks the bigger 72-day cycle.
In terms of technical interest, of note is that there is still some room before our 72-day 'oversold' indicator drops back below its lower reference line - which is something seen closer to peaks for this cycle. Like the VIX for the U.S. stock market, this indicator moves inverse to price action for gold. This is something that we will be keeping a very close watch on, in our thrice-weekly Gold Wave Trader report.
In terms of time, this 72-day cycle is still phased as bullish - and has been projected to push higher into the mid-January to mid-February timeframe. There is a particular focus on the mid-to-late February range to next peak this particular wave, due again to seasonal considerations, with the 20-year seasonal pattern shown on the chart below:

Having said the above, the actual peak for our 72-day cycle could come earlier - or even later than the mid-February timeframe, depending on the accompanying action from technicals.
Stepping back then, once the next peak is in place for this 72-day wave, the favored path is looking for another larger correction phase to play out into late-Spring of this year, which is also in line with the seasonal patterns.
Going further with the above, the late-Spring, 2022 timeframe is when the next bigger low is projected to form, coming as a result of the larger 154-day and 310-day cycles, with the larger of these waves - the 310-day cycle - shown again on the chart below:
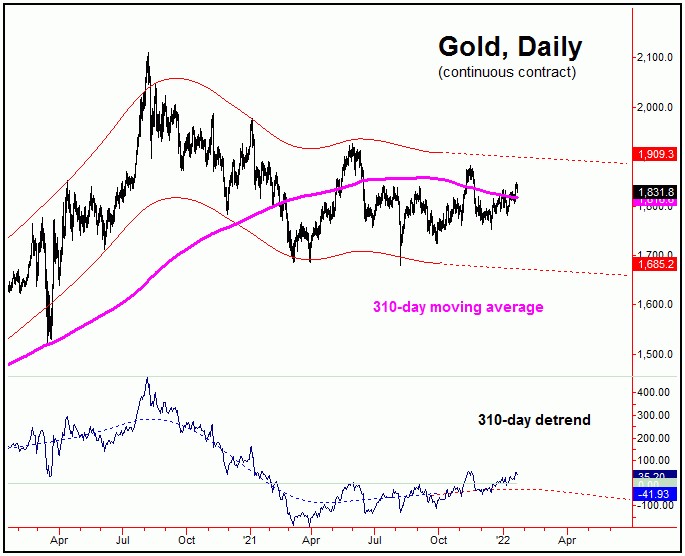
With that, we have an exact downside price 'reversal point', which - if taken out to the downside - will be the trigger for the next expected downward phase of this 310-day cycle to be back in force, with precise details noted in our Gold Wave Trader report. Until that occurs, the overall trend will remain pointing higher into February.
For the bigger picture, from whatever low that does form with the 310-day cycle in the coming months, the probabilities will favor the largest percentage rally of this year playing out into late-Summer, one which is something in the range of 15-25% off the bottom. From there - and also in line with seasonality - we should see another decent decline playing out into later this year, where another 154-day cycle trough would be due. More on all this we continue to move forward.
Jim Curry
The Gold Wave Trader
http://goldwavetrader.com/
http://cyclewave.homestead.com/
********


