Gaining Scale For The OTC Derivative Market


This week I intended to focus on the derivative positions of the US banking system, but I need another week to do the subject justice. But the numbers involved in this market are simply incomprehensible. To reduce these numbers into something which simple human beings can relate, I looked around the internet to see how many leaves there were in the world. As the link included an estimate for the total population of ants in the world, I also included ants in the table below, as well as annual production figures for a sampling of metals from the US Geological Survey for the year of 2010, their latest data.
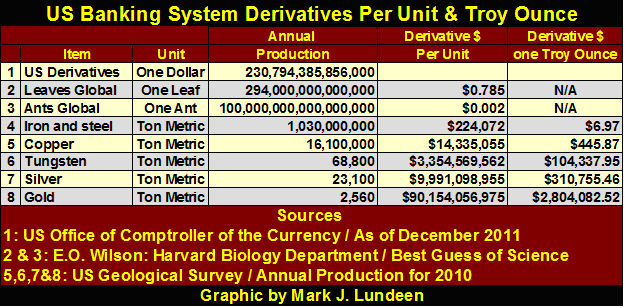
Apparently, the notional value for the OTC derivatives written by the US banking system is only fifty-six trillion short of the total number of leaves in the world. Only when discussing human activities in the OTC derivatives markets can we describe fifty-six trillion as "only!" And in case you were wondering, this estimation of the total number of leavesalso includes the number of needles for conifer trees such as pine and spruce. Just think, if the US banking system should write "only" fifty-six trillion dollars more in OTC derivatives, they could fix the ratio of annual global leaves production (and the needles on pine trees) into a 1:1 ratio. I suppose we should take comfort knowing that derivative production by the US banking system is still three orders of magnitude below where it would make a 1:1 ratio with the Earth's total population of ants.
My comparison with the annual metal production and notional value of the US banking systems assumes that, for example, there is only iron and steel, and the notional valuation in derivatives, which we all know is not the case so take these dollar figures with a large pinch of salt. But pricing these metals on the potential liabilities the US banking system could incur is a useful exercise in gaining insight into the ungodly scale of the US banking system's exposure in the OTC derivative market.
For example, take tungsten production, where the US banking system has $3.345 billion in notional value (potential liability) for each metric ton of what some now believe is a suitable monetary-gold substitute. So, understand that there is no real connection between the two, other than if the US banking system is blown up by their derivatives' position, global production of tungsten, and everything else will plummet!
As far as I'm concerned the most important item in the table above for investors is the annual production figures for gold and silver. For every metric ton of gold produced globally, there are only nine tons of silver produced (9:1). And unlike gold, which is the most hoarded commodity in the history of mankind, silver in today's industrialized world is no longer hoarded as money, but primarily consumed and seldom recycled. At today's close, the Silver to Gold Price Ratio (SGR), or the number of ounces of silver one ounce of gold will purchase was at 58.75 ounces of silver to one ounce of gold (58.75:1). If today the SGR were to become 9:1, silver would be revalued to $174 an ounce. It's simply amazing how underpriced silver is today. At current prices, silver is bound to become the investment of our generation!
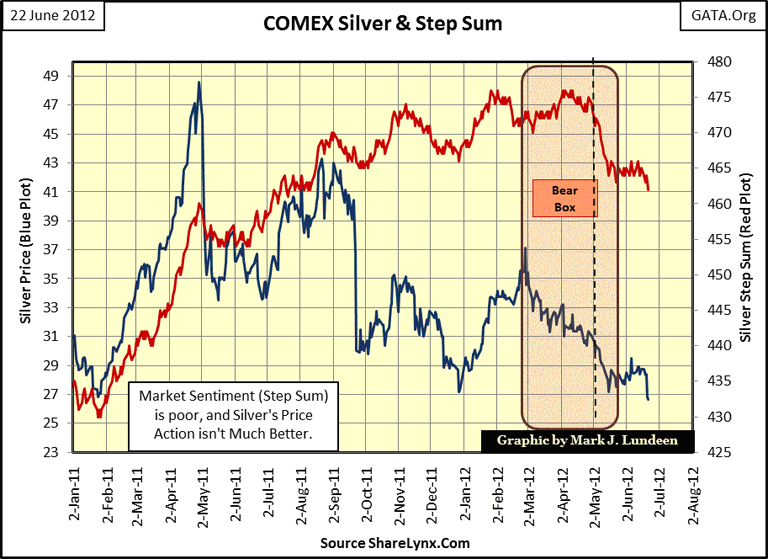
So, knowing silver will bring us riches beyond our wildest dreams, how did silver do this week? Ah--- about as well as I thought it would do last week; not good. Well, whatever our wildest dreams would have us believe, somethings just take more time and patience than most people have. Let's look at silver and its step sum. Silver's bear box terminated in early May when silver's price trend turned upward, but without enthusiasm. Then this week it bloke below its lows of early May as its step sum (market sentiment) also turned down.
But looking at the big picture in silver's 2001 to 2012 Bear's Eye View (BEV) chart below, the price of silver is performing just as it has since the beginning of its bull market eleven years ago. It gets whacked down by the "policy makers" and then takes its own sweet time recovering to new bull market highs. We can see this annoying feature in our silver 2001-12 bull market in the table posted on my BEV chart below, listing the number of trading days it's taken silver to go on to new bull market highs from one correction to the next. To tell you the truth, should silver make a new high of the move by Christmas (day 421), it would be par for the course after a price correction of 45%. So now we watch, and wait to see if silver's current correction is about to timeout with some explosives moves to the upside by August or September.
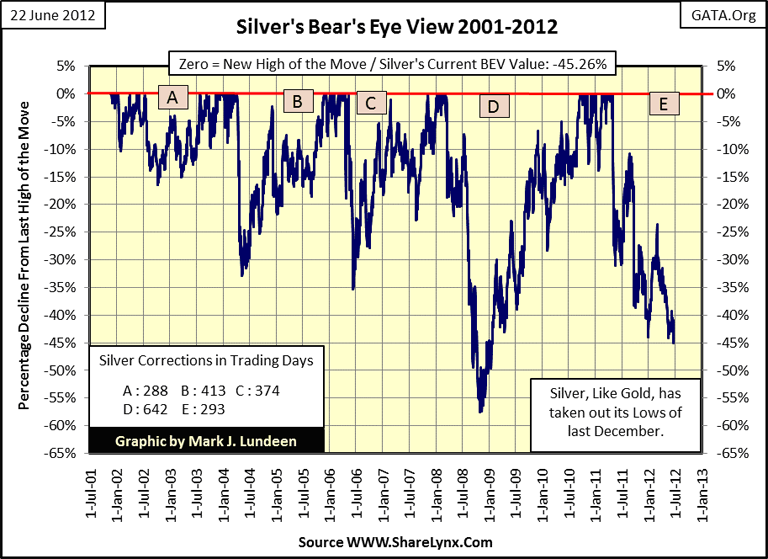
Clearly, now is not the time to panic, but a very attractive buying opportunity in the silver market.
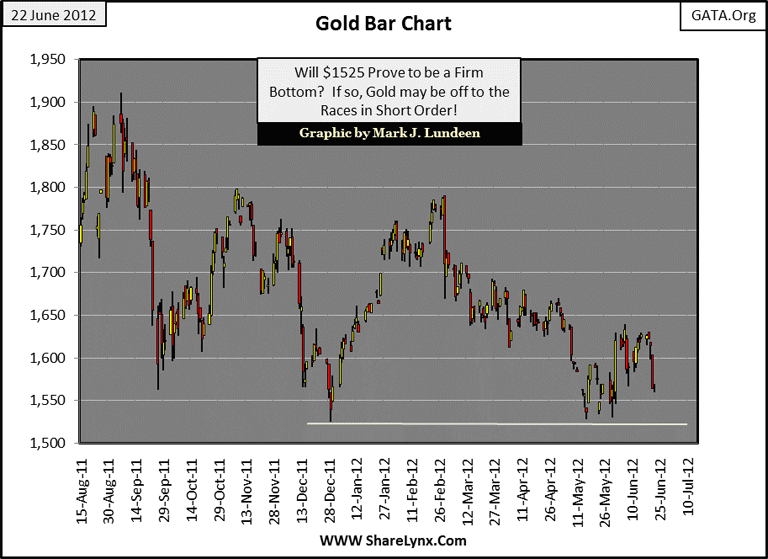
Let's move on to gold. Just as I feared, last week's buy signal failed. It's like I said last week, the turn up in gold's price trend lacked that "I'm mad as hell, and I'm not going to take this anymore" look to it. In step sum analysis, a strong buy signal forms a clearly defined "V" formation in both the price and step sum trends, though there have been great entry points into a market where the price trend (the most important trend) has sharply turned up without the step sum (market sentiment) following. Seeing a rising price trend with its step sum failing to follow forms what is called a bull box, which is very good. However, that is clearly not the case now.
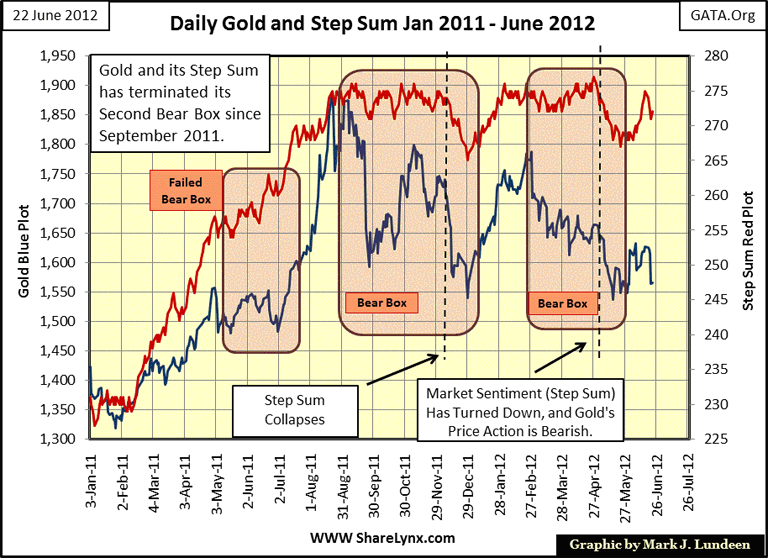
So what happens next in the gold and silver markets? To be honest, I don't exactly know what is coming our way in the next few weeks or months. But I'm watching gold's low of last December ($1539.90 closing price) in the chart below. Should gold hold above its closing lows of last December for the next few weeks, the gold bugs should have a very Merry Christmas for 2012.
Remember, the most important thing retails investors need to do is to identify a bull market in its early phases, and then hold on for dear life during times of uncertainty, like right now. Things have changed greatly in the past decade. The world's central banks are now buying gold by the ton. Why are they doing this? Most likely they understand the inflationary consequences of having the yield for long-term US Treasury bond fall below 2.5%, which is certainly well below the actual rate of inflation. That, plus a quick study of the table at the start of this article should put your mind at rest about the potential for gold and silver over the next few years. It's enormous from these prices!
Here's a chart for the NYSE Financial Index with its step sum. It doesn't look too bad until you look at the BEV scale to the left. These companies received trillions in support from the US government in terms of dollars and were also granted changes in the accounting rules for reporting their earnings, yet they still collapsed 78% during the credit crisis! There is something wrong here.
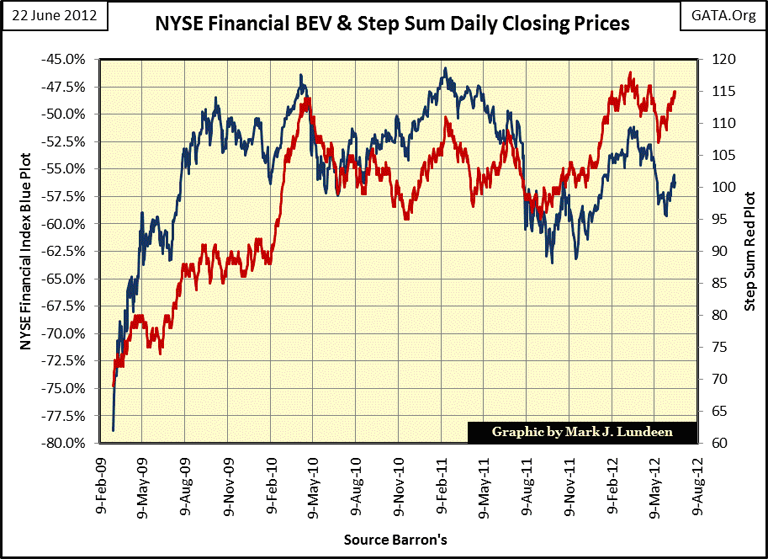
If the financial system still operated under the accounting rules, business practices and government regulations that were in place back in the 1960s, most of these banks would have gone under years ago. And since the Crash of October 1987, more times than not, these companies required a life line from the Fed to stay afloat.
In the early 1990s, years before the high-tech boom began to get hot, Greenspan was forced to lower the Fed Funds rate to what was then described as an incredible 3% to save these banks who could find nothing better to finance than hostile-leveraged buyouts, and risk money at the top of the 1950-90 bull market that once was Japan. This 3% Fed Funds rate in the early 1990's allowed the big NY banks to purchase as many US Treasury bonds (then yielding over 8%) as they wanted, to "re-liquefy" their balance sheets at the taxpayers' expense. But the most irksome thing about "liquidity" is its ability to flow from one market to another, as was the case in the early 1990s when a stealth-banking bailout lit the fuse for the high-tech rocket.
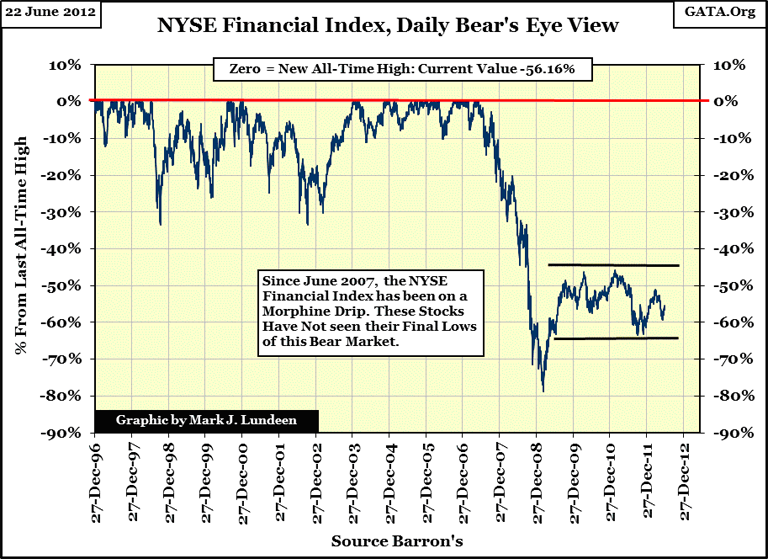
Here was the true origin of the high-tech bubble; the Federal Reserve bailing out the banks from their late 1980's fiascos in the Japanese markets and domestic dalliances in junk bond financing for the funding of hostile leveraged buyouts. After the high-tech bubble popped in 2000, the Federal Reserve once again "re-liquefied" the big NY banks to save them from their high-tech IOPs. This massive "liquidity injection", plus Congress's "affordable housing" programs inflated a huge bubble in the US mortgage market, which resulted in the 78% decline in the NYSE Financial index by March 2009 as seen in the chart above.
Today, Doctor Bernanke is once again "re-liquefying" the banking system, (just as that quack central banker Greenspan did before him), which is causing the most massive bubble of them all, in the global bond markets. The current bubble is the "big one." After this bubble pops, there will be nothing left to inflate except for the price of gold, silver and the cost of living, as the world experiences a historic deflationary blowback from the many decades of inflationary folly by the "policy makers." There is big trouble ahead of us, and most people don't have a clue of what is coming their way.
Look at this fifteen year BEV chart for the NYSE Financial Index; it's pathetic!
These companies manage the global payment system, the system that connects each human to everyone else through the global market place. Should these financial companies go down, and they just mightbecause there isn't a single adult managing Washington or Wall Street, it won't make sense to wake up and go to work in the morning, as it will become impossible to get paid. Even having gold and silver won't help during a crisis where shopping centers can no longer restock their shelves, but nothing lasts forever, even a depression greater than the Great Depression. It's in the aftermath of this disaster; when people will once again begin asking what the color of your money is that gold and silver will come into its own; as green will be out, and gold and silver will be in.
I truly hope I'm wrong because I don't want to live a few years, or a decade in such a chaotic world. But in any event, ignoring the weekly fluctuations in the price of gold and silver seems a prudent thing to do, as gold and silver are next in a long line of bull markets, reaching back to the 1980s:
- 1980s Japan and Junk Bonds' bubble deflate into High Tech Stocks of the 1990s.
- 1990s High Tech bubble deflates into 2000s US Mortgage Market
- 2000s US Mortgage bubble deflates into the Global bond markets of the 2010s
- And finally, the Global Bond Market bubble should deflate into the Gold and Silver markets.
So get a position in the old monetary metals before interest rates begin to rise, and bond prices begin to fall. And believe me, gold and silver bull markets LOVE interest rates rising up to double digits. This indicates that wealth is flees debt instruments, and running into gold and silver for its survival, as was the case during the 1969-80 bull market for gold and silver.
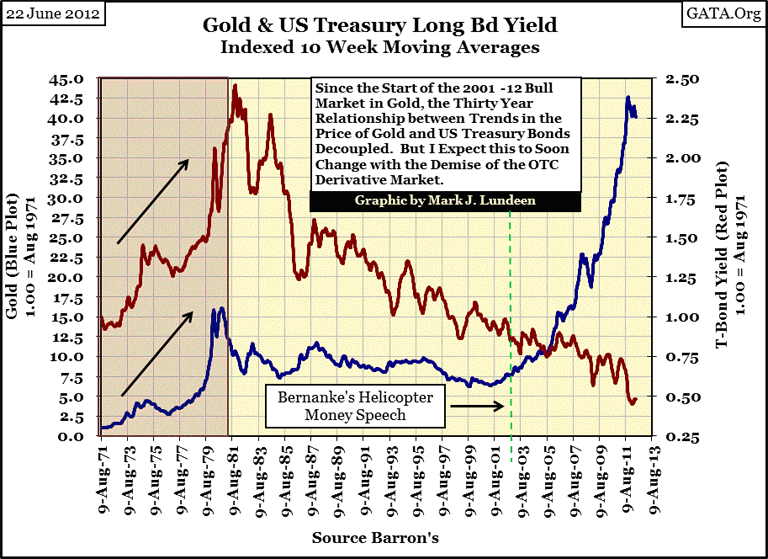
Seeing how gold has risen continuously for the past twelve years, far above its highs of 1980, as bond yields collapsed is proof not only that that the US Treasury market is being managed by the "policy makers", but the high-and-mighty have lost control over the pricing in the gold and silver markets.
Like all bubbles, the global bond markets' too will end in deflation… and wealth will move somewhere else; and I expect it will flow into gold and silver and our cost of living items. There is nothing good about struggling in an economy where your assets are deflating, while your cost of living is inflating! Right now, it's advisable to make like an Asian-central bank by reducing your exposure to financial assets from Wall Street, and buy gold and silver by the ton or by the ounce, while you still can.
Mark J. Lundeen
[email protected]
[email protected]
More from Gold-Eagle


