Gold Set for Next Leg Higher; U.S. Stocks Update


 As mentioned in past months, Gold formed a key peak back in mid-April, doing so at the 3537.80 figure (August, 2025 contract). From there, a correction was seen into mid-May, with the metal dropping down to an eventual low of 3151.20 - before consolidating the action into June/July.
Gold Cycles, Short-Term
For the short-term picture, the most recent correction for Gold came from the 10-day cycle, as well as a larger 34-day component. Here again is our smaller 10-day wave:
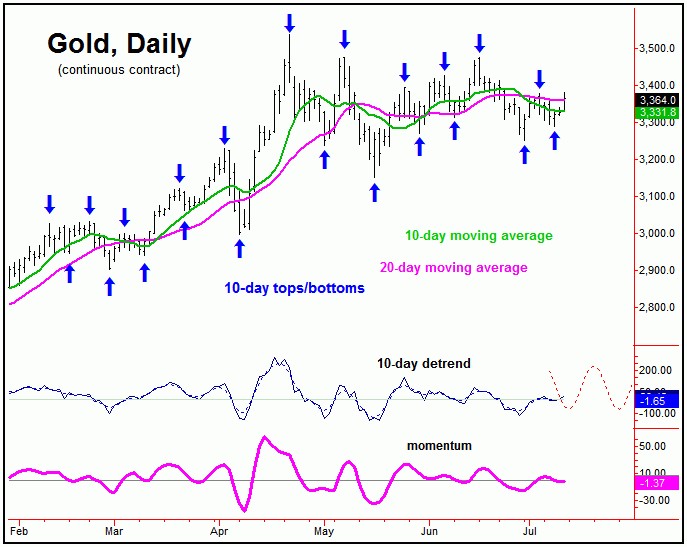
With the action into late last week, the 3290.20 swing low (August, 2025 contract) is seen as our last bottom for this 10-day wave, which has it only 2 trading days along to the upside - and with that should be pushing higher into the middle part of the new trading week (or later). Its next trough is due around the July 21st date, but can be plus or minus several days in either direction.
The 34-Day Gold Cycle
Stepping back slightly, the last bottom for our larger 34-day cycle in Gold was due to form around the early-July window, plus or minus. Here again is our 34-day wave:
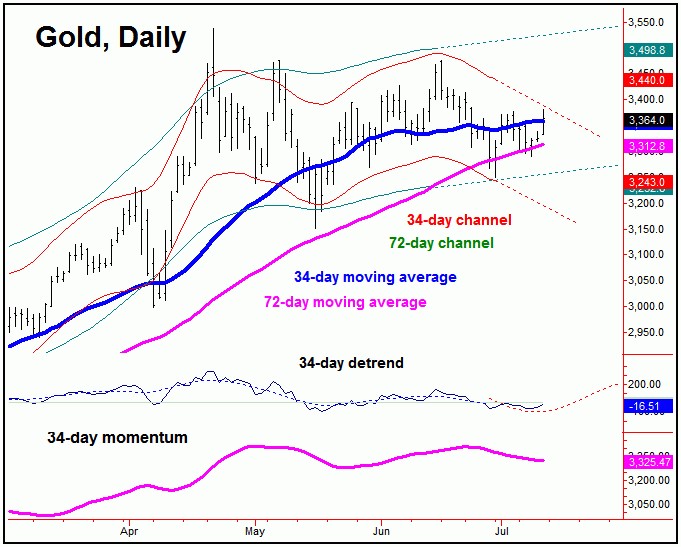
In terms of price, our 34-day cycle now looks to have bottomed out at the 3250.50 figure into late-June, which is slightly on the early side - but is within the average variance of a low for this cycle.
With the above, the next good rally phase is expected to come from this 34-day cycle, as well as with the bigger 72-day wave (more on this in a bit). In terms of time, the ideal path for this rally to play out into looks to be the mid-to-late August window of this year.
In terms of price, the average rallies with the 34-day cycle - when coming off the pattern of a 'higher-low' - have been some 9% or more off the bottom. Thus, taking the 3250.20 figure suggests the potential for the metal to push up to the 3540's into August, before setting up a top with the combination of 34 and 72-day waves.
Gold's 72-Day Cycle
As mentioned in my last article from June, our 72-day wave was seen as having bottomed back in mid-May of this year, doing so at the 3151.20 figure. Even with this, another decline was expected into early-July, coming from the aforementioned 34-day wave.
Here again is our larger 72-day cycle in Gold:
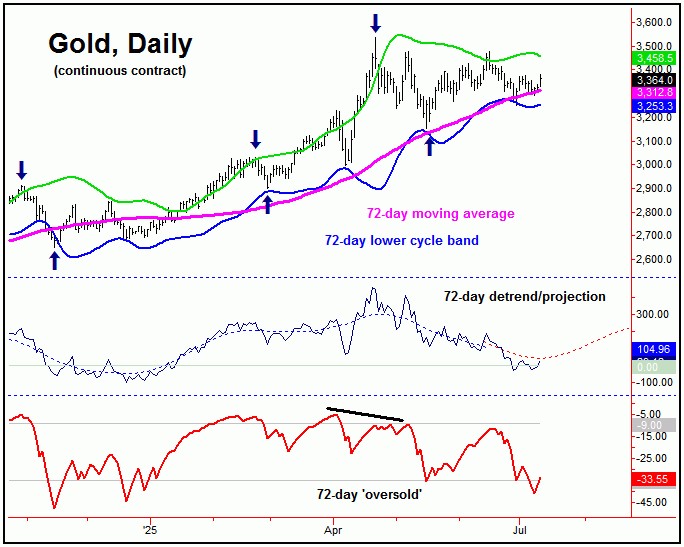
In terms of price, the average price rallies with this 72-day cycle have been some 13-14% from trough-to-peak, suggesting the potential for a push up to the 3560's or better in the next 4-8 weeks, which is in line with the notes regarding our smaller 34-day wave.
Having said the above, I should stress that the 3250.50 swing low (August, 2025 contract) has to hold any downside, in order to keep the above upward phase assessment with the 34 and 72-day cycles intact.
Stepping back, our 72-day wave would be looking for another peak into mid-to-late August. From there, the ideal path would favor its next correction to play out into mid-September, though it is too early to suggest how far (with price) that decline might carry.
Gold's 154-Day Cycle
For the mid-term view, the bottom expected into mid-September or later should end up as not only a trough for our 72-day wave, but a larger 154-day cycle that we also track - and which is shown on the chart below:
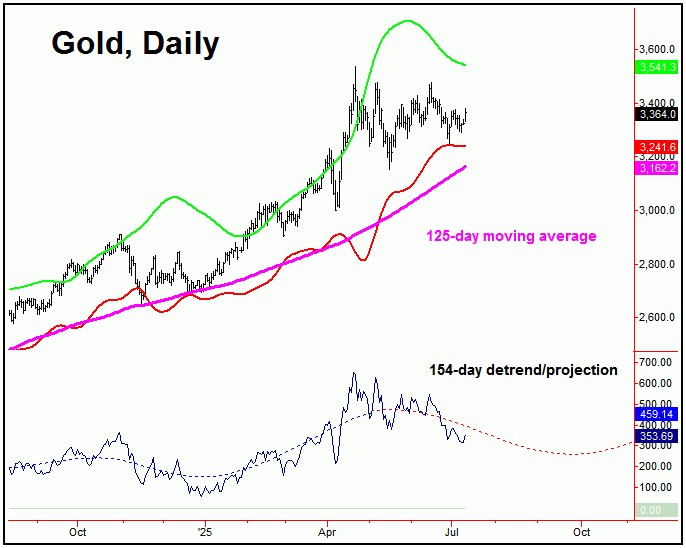
With the above, a 72 and 154-day combination low into mid-September - if seen - would be expected to give way to another sharp rally of some 14-20% in the following months, ideally playing out into the early-2026 window. That rally should eventually peak a larger tracked four-year cycle in Gold, before giving way to a fairly sharp decline into later next year; more on this in a future article.
Technical Considerations
Back in mid-April, there was a key divergence formed between price and our Gold Timing Index, which is shown again on the chart below:
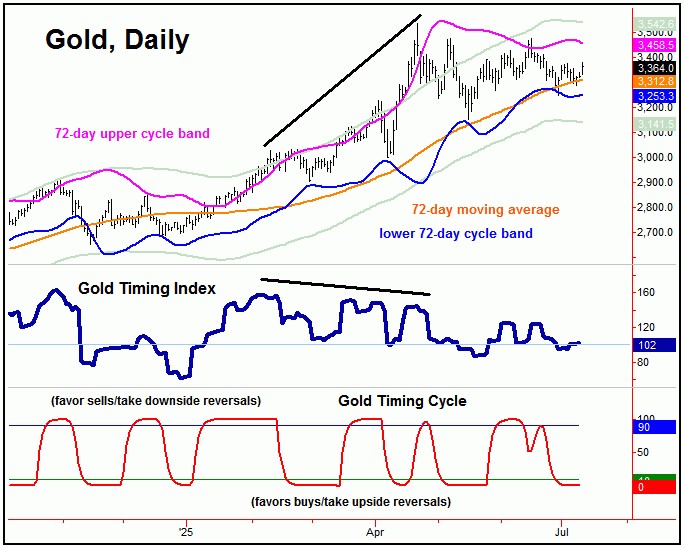
Adding to the notes above, the divergence between our Gold Timing Index and price back in April set the metal up for its last correction of significance - coming from the 72-day time cycle.
Of key note is that the most recent action has dropped our Gold Timing/Cycle indicator (lowest pane, in red) back below its lower reference line, doing so at the 3287.60 figure. The position of this indicator was viewed as supportive of a rally with the 34 and 72-day cycles, with that rally now favored to be in force - with more precise details posted in our thrice-weekly Gold Wave Trader market report.
U.S. Stock Market (Update)
As mentioned in past articles, the last mid-term bottom for U.S. stocks (as measured by the S&P 500 index, or 'SPX') came from the combination of 180 and 360-day cycles, with the current position of these waves shown below:
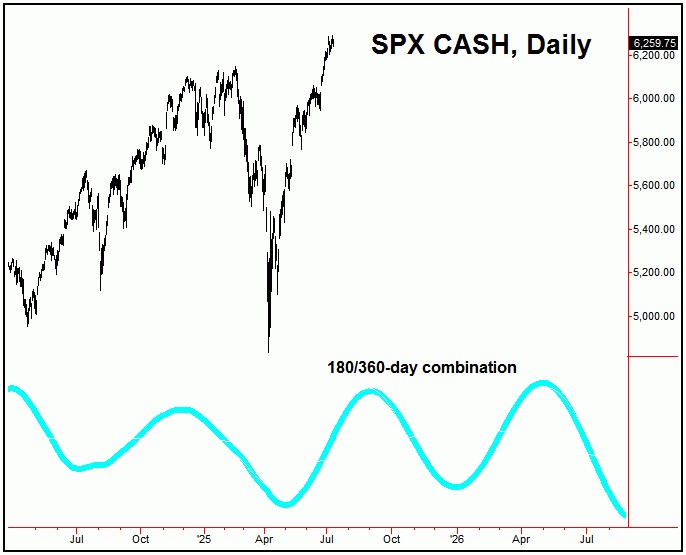
As mentioned back in June, the combination of these waves were seen as pushing higher, with the bigger 360-day component ideally moving up into early next year. In terms of price, the average rallies with this 360-day cycle have been some 40% from trough- to-peak, which suggests the potential for a push up to the 6800 SPX CASH figure (or higher) before this wave tops.
Here again is that 360-day cycle in U.S. stocks:
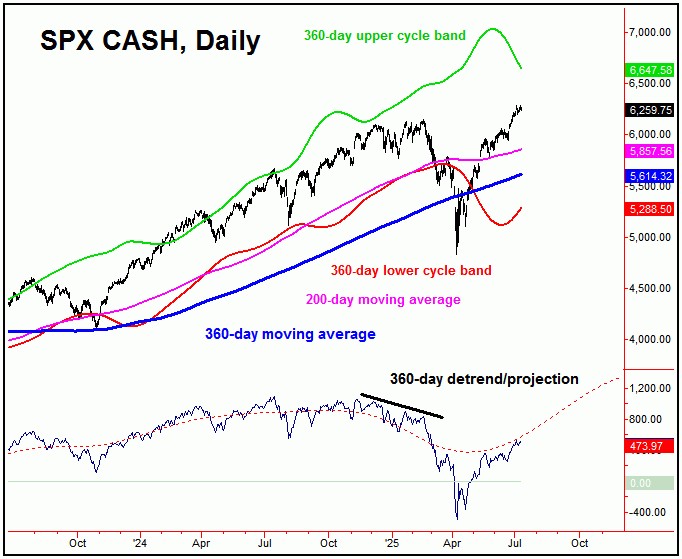
In-between now and the early-2026 window, there should be the normal correction phases with the smaller-degree waves, with the next one of significance expected to play out into the late-September timeframe - ideally off a peak which is favored to be made fairly soon, sometime between now and early-August.
This peak should come from the combination of 45 and 90-day cycles in U.S. stocks, with the smaller 45-day wave shown below:
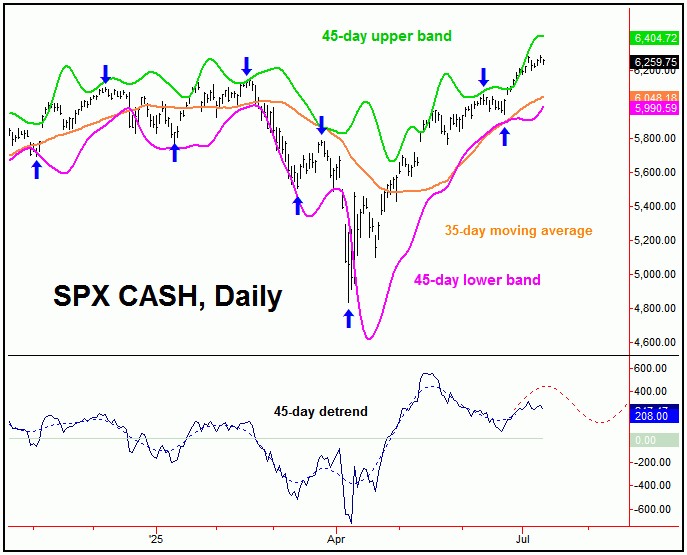
In terms of time, the last trough for our 45-day cycle on the SPX was due around late-June, with a particular focus (in our daily Market Turns report, which tracks the U.S. stock market) on the June 22-24 window for this to play out into.
With the above said and noted, the last low for this 45-day wave was later confirmed as the 5943.23 bottom on the SPX, made on June 23rd of this year. From there, the path favored a minimum push back to new all-time highs for the year, though with the 6300- 6500 level noted as the ideal price magnet.

Stepping back then, the next key short-term peak in U.S. stocks is expected to come from this 45-day cycle, due anytime between now and early-August. From there, as mentioned earlier, a decline is anticipated to play out into late-September, before turning sharply higher by some 13-14% or more into the late-2025 to early-2026 window, with more exact details posted in our daily/weekly Market Turns report. Stay tuned.
Jim Curry
The Gold Wave Trader
Market Turns Advisory
http://goldwavetrader.com/
http://cyclewave.homestead.com/
********


