Gold May Be Boring, but Silver is Soaring!


“If I may open, mmb, Gold is now +27.7% this year: no way that’s boring…”
Admittedly, dear Squire, perhaps a bit exaggerated is our title’s “boring” description for Gold. So far this century, the 28-week year-to-date increase of +27.7% ranks second only to such like stint during 2006: so in that broader context, to your point, ’tis rather exhilarating, one has to say.
Yet, on the heels of last week’s piece “Gold’s ‘Weak’ Up Week…” — price having since settled yesterday (Friday) at 3370 — through this year’s 28 weeks ’twas Gold’s third narrowest as measured by percentage from low (3290) to high (3382), i.e. +2.8% … “boring…”
“So a week’s range of less than 3% isn’t very, as you like to say ‘alacritive’, eh mmb?”
Squire, ’tis certainly not very characteristic of 2025-to-date. Thus far this year, Gold’s 20 up weeks have averaged a low-to-high range of +4.1% versus a high-to-low average range of -4.7% during the eight down weeks. Thus this past week’s full range of +2.8% was rather skimpy.
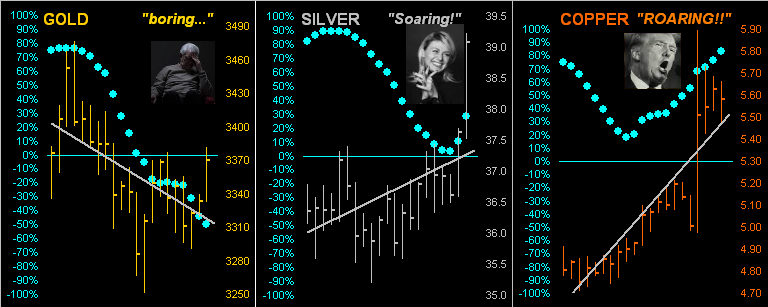
That noted, the Oxford English Dictionary (OED) suggests as an antonym for “skimpy” the word “abundant”. And for Sweet Sister Silver, her week’s range — and moreover net percentage gain of +8.0% — were very abundant, indeed as she found her price yesterday “Soaring!” to its highest daily close (39.08) since 21 September 2011! ‘Twas her sixth-best weekly percentage gain so far this year (for which she’s +33.4% all told), in turn driving down the Gold/Silver ratio from 90.1x a week ago to now 86.3x … which nevertheless still means Silver is cheap given the ratio’s century-to-date average of 69.2x. Means reversion is a beautiful thAng.
To visualize what it means to find Gold “boring…” versus Silver “Soaring!” we’ve the following three-panel graphic of our Metals Triumvirate such as to include Copper “ROARING!!”, the red metal year-to-date now +38.8% and leading all eight of our BEGOS Markets (Bond, Euro/Swiss, Gold/Silver/Copper, Oil, S&P 500). The graphs’ bars as arrayed are their respective last 21 trading days (one month), replete with grey diagonal linear regression trendlines and the ever-popular “Baby Blues” which depict the day-to-day consistency of trend. And obviously of late, Sister Silver — rather than adorned in her precious metal pinstripes — has instead opted for her industrial metal jacket so as to “party hearty” with Cousin Copper. That noted however, Silver’s rightmost two bars (Thursday and Friday) are more directionally aligned with Gold than with Copper. For at the end of the day, Sweet Sister Silver — like Gold — is money:
In fact as a rare treat, let’s bring up Silver’s weekly bars and parabolic trends from a year ago-to-date, the duration below of her blue-dotted Long trend now eight weeks. (You did not forget the Silver, did you, mate?):

Whereas in swerving back to poor ol’ boring Gold, the yellow metal just recorded its ninth week of red-dotted parabolic Short trend:
As for Gold’s pace, ’tis run a bit out of puff of late. Here we’ve Gold’s expected weekly trading range by points so far this year. Note it has nearly doubled from back in January, but in the recent boredom has begun to wane, the current read for next week being 145 points, albeit price has underperformed the expected range these past four stints:
But: has the Economic Barometer finally ceased its wane? To borrower from the Federal Open Market Committee’s Policy Statement boilerplate, we too shall “carefully assess incoming data, the evolving outlook, and the balance of risks”. Either way, on the heels of White House Press Secretary Karoline Leavitt having “X’d” a week ago “…the economy is BOOMING…” (yes really), this past week’s set of only four incoming metrics nonetheless on balance gave the Baro a wee boost. Thereto, May’s Wholesale Inventories shank (a positive, suggesting goods are on the move), Initial Jobless Claims were less, and the U.S. Treasury actually recorded a budget surplus in June (again, yes really) for just the fifth time in three full years as (hat-tip Reuters) duty collections by U.S. customs posted a record fiscal-year high given (our descriptor) “Trump Tariffs!” The week’s only weak metric was Consumer Credit having significantly slowed in May … so does that indicate the main driver of the U.S. economy is getting tapped out? At least as far as the S&P 500 is concerned, tapped-out earnings (relative to price) continue not to matter. Here’s the Baro:
Moreover comes this ensuing week for which the Baro anticipates 18 metrics including retail and wholesale inflation for June. Shall they suggest further cooling … or heating up in Summer’s swooning? On verra…
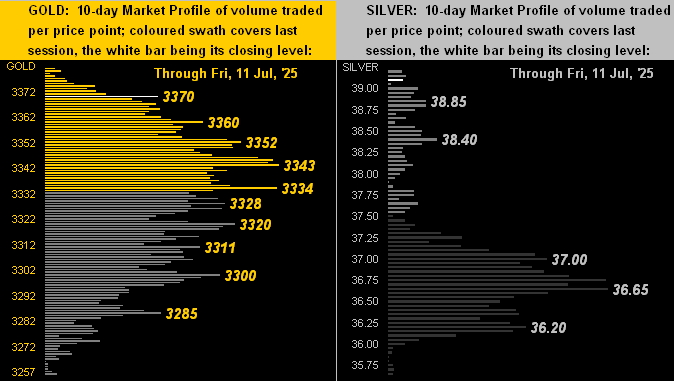
To the Precious Metals’ 10-day Market Profiles we turn for both Gold on the left and Silver on the right. And to the yellow metal’s credit, in the latter part of the week it muscled up through quite a density of overhead volume-dominant resistance toward getting to this 3370 level. As for the white metal, last week we’d already seen her underlying volume-dominant support, from which she soared yesterday as aforementioned to her highest daily settle in nearly 14 years! Brava, Brava, Sister Silva!!
And so we close with this from the “Hype of the Week Dept.” featuring Nvidia (NVDA). (Even as we “don’t do stocks”, this was too good to avoid the curiosity of doing the math). Ready?
The mighty video card maker turned “AI” chipster now tops the S&P 500 market capitalization at just over $4T. Thus for these last couple of days we’ve been hearing time and again that “Wow! Nvidia’s worth over $4T!!” … except such use of the vernacular is incorrect. ‘Tis worth nowhere near $4T.
Rather, by the company’s balance sheet as recorded at the end of this past Q1, the net worth is $84B. In other words, the amount of money invested in Nvidia as marked-to-market today is 48x what the company actually is worth; (that shan’t be on Bloomy, nor FoxyB, nor CNBS, neque alii). Such stat is actually quite similar to that for Apple (AAPL)’s 47x; however, far more conservative is Microsoft (MSFT)’s 12x, even as its net worth is some four times greater than that of Nvidia.
Still, for those of you scoring at home with a marked-to-market investment at present of, say, $10,000 in Nvidia, were the company to instantly (in theory) liquidate, you’d receive (if lucky after the bondholders) about $200, i.e. only 2% of “what you thought you had”. Have a nice day.
‘Course the lesson for you WestPalmBeachers down there is: when you buy shares in a publicly-traded company, it doesn’t get the money; it goes to the seller. So try not to get carried away…
And congrats if not having forgotten Soaring Sister Silver!
Cheers!
…m…
www.TheGoldUpdate.com
www.deMeadville.com
and now on “X”: @deMeadvillePro
********

Mark Mead Baillie has had an extensive business career beginning in banking and financial services for two years with Banque Nationale de Paris to corporate research for three years at Barclays Bank and then for six years as an analyst and corporate lender with Société Générale.
For the last 22 years he has expanded his financial expertise by creating his own financial services company, de Meadville International, which comprehensively follows his BEGOS complex of markets (Bond/Euro/Gold/Oil/S&P) and the trading of the futures therein. He is recognized within the financial community of demonstrating creative technical skills that surpass industry standards toward making highly informed market assessments and his work is featured in Merrill Lynch Wealth Management client presentations. He has adapted such skills into becoming the popular author each week of the prolific “The Gold Update” and is known in the financial website community as “mmb” and “deMeadville”.
Mr. Baillie holds a BS in Business from the University of Southern California and an MBA in Finance from Golden Gate University.
More from Gold-Eagle


