Gold Forecast: Mapping Gold & U.S. Stock Markets


 With the action seen in recent months, Gold formed a peak back in mid-April, doing so at the 3537.80 figure (August, 2025 contract). From there, a sharp decline was seen into mid-May, with the metal dropping down to an eventual low of 3151.20 - before rallying back into mid-June.
Gold Cycles, Short-Term
For the very short-term, the current rally is coming from the 10-day wave, as well as the larger 20 and 34-day cycles. Shown below is the 10-day cycle in Gold:
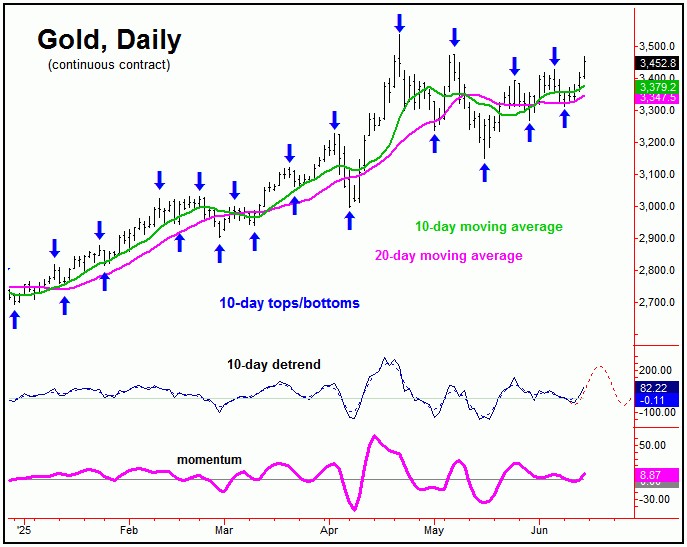
In terms of time, the next peak for this 10-day wave is projected for the June 17th, but with a plus or minus variance of a day or so in either direction. The chart below shows the actual combination forecast for the 10 and 20-day cycles:
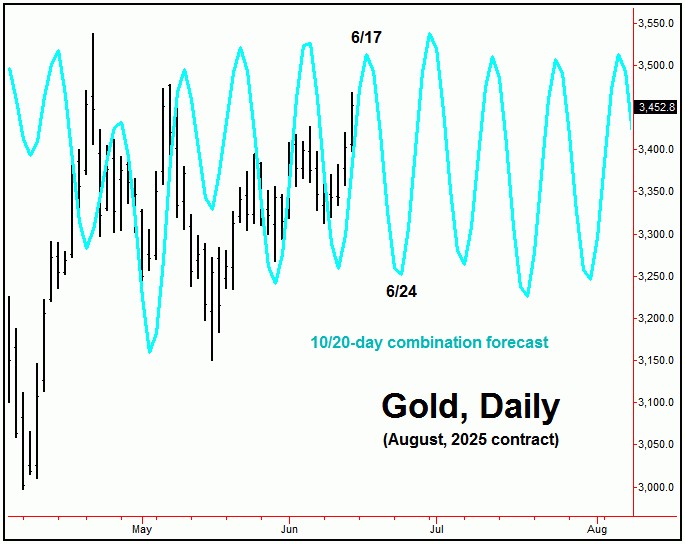
For the short-term picture, additional strength is projected to play out into at least early this week, coming from these 10 and 20-day cycles in Gold. From there, a correction would be expected into a low that is projected for June 24th, plus or minus, with the 10-day moving average acting as a normal price magnet.
The 34-Day Cycle in Gold
Stepping back slightly, the upward phase of the bigger 34-day wave is still deemed to be in force, with its last low having been projected for the mid-May timeframe. Here again is that 34-day component in Gold:
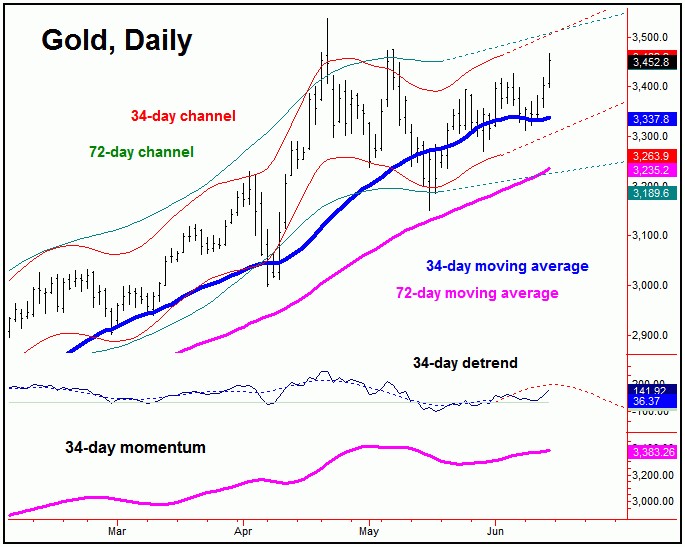
In terms of patterns, the ideal path favored a countertrend rally with our 34-day cycle, before turning south into a more key low, due around the late-June timeframe - and coming from our larger 72-day wave, shown on the chart below:
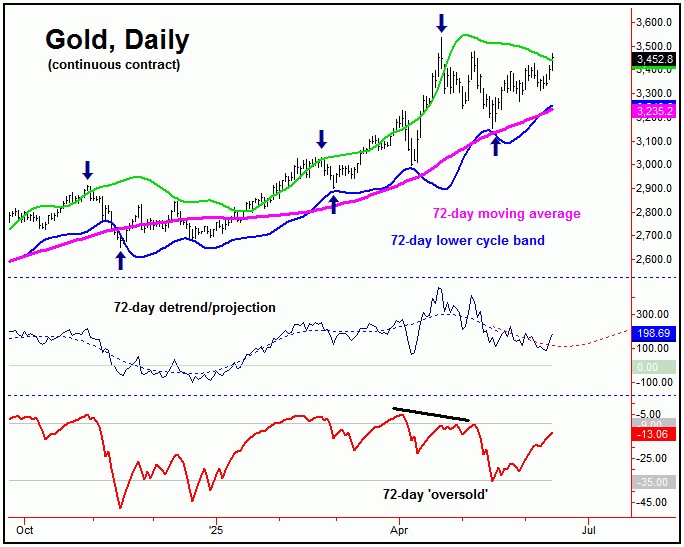
As mentioned, a countertrend rally with the 34-day wave was favored to drop back for a tag of the 72-day moving average into late-June, before bottoming the swing for another rally into mid-Summer or later.
Having said the above, the fact that price has managed to stab through the upper 72-day cycle band nearly always means that the upward phase of this (72-day) wave is back in force, which - if correct - will now favor a push back to new all-time highs (above 3537.80, August contract) in the short run.
On or after higher highs for the swing, the smaller 34-day wave should form its next peak - giving way to a decent decline into what looks to be early-to-mid July. In terms of price, the 34-day moving average would be a normal magnet to that correction.
Adding to the notes above, the patterns should favor the next downward phase of the aforementioned 34-day wave to end up as countertrend, due again to the newly-viewed position of the bigger 72-day component.
Technical Considerations
Back in mid-April, there was a larger divergence having formed, between price and our Gold Timing Index, which is shown again on the chart below:
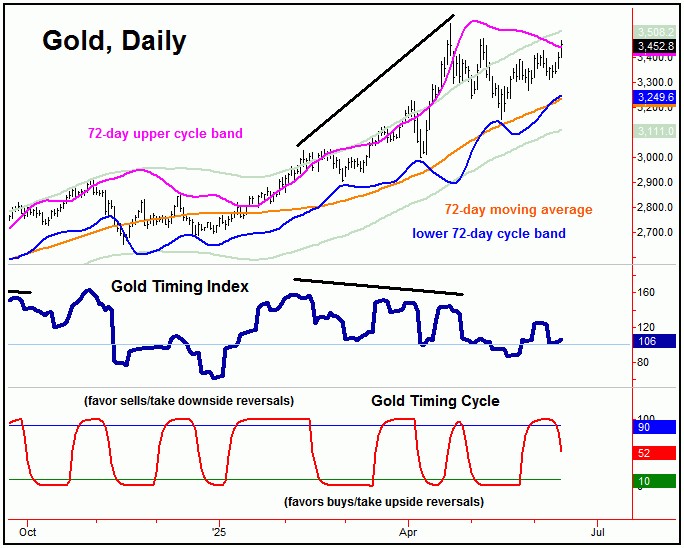
Adding to the notes above, the April divergence between our Gold Timing Index and the new price high was viewed as a bigger technical negative, and with that supported the idea of a sharp correction playing out in Gold - which we obviously saw - with the metal dropping some 11% from April into mid-May.
So what is this indicator telling us right now? With a current reading of 106, it looks set to register yet another divergence on any new price high, which our 72-day cycle component says should be coming.
Should this divergence be seen, it would likely set Gold up for yet another sharp decline, which, as mentioned, should come from the smaller 34-day cycle in Gold - and playing out into early-to-mid July, though a move expected to end up as countertrend.
U.S. Stock Market (Update)
Back in early-February of this year, I posted an update on the U.S. stock cycles, suggesting a market which was topping out - and due for a sharp decline into April. In terms of price, I mentioned the 200-day moving average as the expected price magnet.
Back in early-April, as the U.S. stock market was selling down sharply, I posted another article (i.e., 'Markets Crashing into Spring Cycle Low'). That article projected a key trough for the early-to-mid April window, based upon the combination forecast shown below:
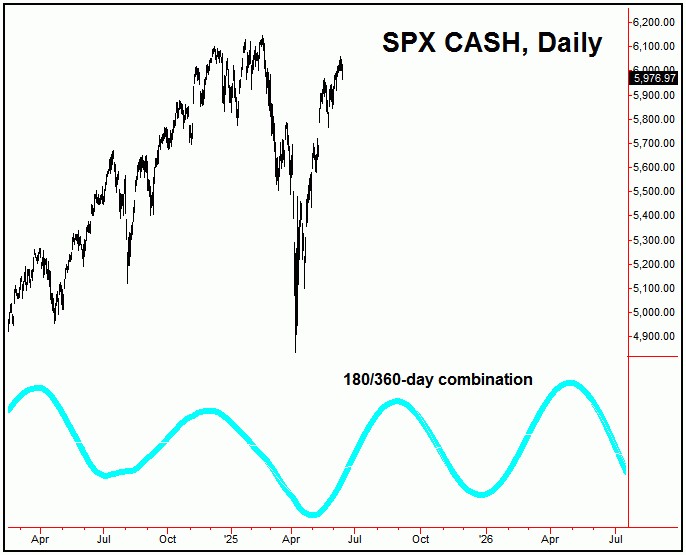
The above forecast chart comes from the combination of the two dominant mid-term cycles that we track in our daily/weekly Market Turns reports, which are the 180 and 360-day cycles. As noted, these waves were projected to trough into early-to-mid April, before turning sharply higher into later this Summer.
Later, we were able to confirm the April trough as the last bottom for the mid-term cycles, which should favor additional strength going forward, due to the backdrop of the larger 360-day cycle, which is shown on the chart below:
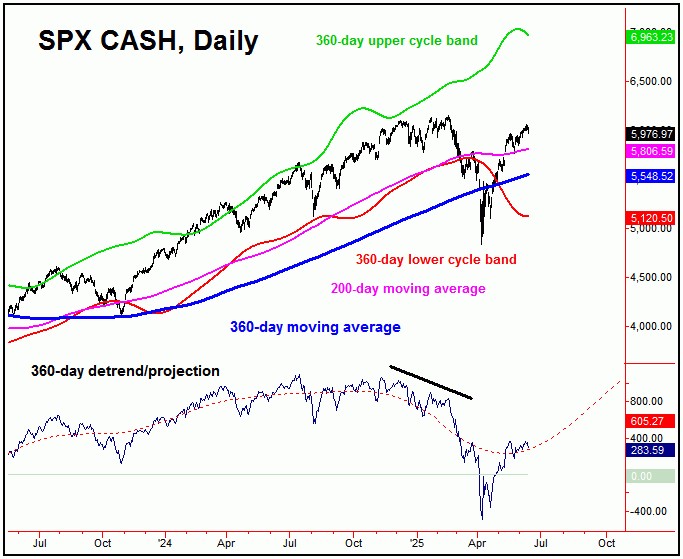
In terms of price, the average rallies with this 360-day cycle have seen a rise of some 40% from trough-to-peak, and with that there is the potential for a push up to the 6800 SPX CASH figure before this wave tops.
Adding to the above assessment is the fact that the upper 360-day cycle band is currently around the 6963 SPX CASH figure (though declining). Following a 360-day cycle bottom, this upper band will normally act as the eventual magnet to price - which is obviously well above current price levels.
Even said, the current upward phase off the April low is very extended, and thus is due for a sharp correction in the days ahead. That decline should come from a smaller-tracked 45-day cycle, which is shown on the chart below:
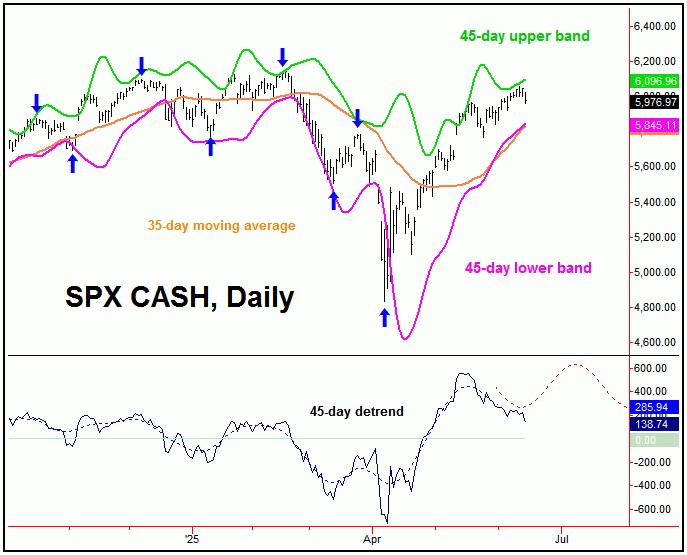
In terms of price, our downside reversal point for this 45-day cycle in U.S. stocks is set at the 5915.44 SPX CASH figure. In other words, any push back below that number - if seen at any point going forward - would best confirm the downward phase of this wave to be back in force, thus favoring additional weakness through the same.
In terms of patterns, due to the position of the larger 180 and 360-day cycles, the coming correction phase of our 45-day wave is anticipated to end up as a countertrend affair. If correct, what follows should be another sharp (9% or more) rally playing out into later this Summer, before topping the market for a good percentage (but countertrend) decline into the Autumn of this year. Stay tuned.
Jim Curry
The Gold Wave Trader
Market Turns Advisory
http://goldwavetrader.com/
http://cyclewave.homestead.com/
********


