Gold Price Forecast: The 4th Turning Is Upon Us
 share
share
 share
share
 share
share
 share
share
 share
share
 Gold investors: the fourth turning is upon us.
Yes, that is right – a signal so rare, so powerful, and so ominous that it has appeared only three times in the last 130 years – has now shown itself.
And this signal portends to years of gains ahead for gold – and years of losses ahead for industrial stock (Dow, S&P 500) holders.
This signal is so significant that it will be the foremost tool to guide precious metals investors over the years ahead.
What is the signal?
It is the Dow to Gold Ratio – and it is making only its Fourth Turning of the last 130 years.
What is the Dow to Gold Ratio?
The Dow to Gold Ratio measures the number of ounces of gold required to purchase one share in each of the 30 companies in the Dow Jones Industrial Average.
The Dow Jones goes back to 1896, when Charles Dow and Edward Jones created the index of stocks to measure performance of the US economy.
Gold, of course, goes back to time immemorial, having been used as a store of wealth for at least five millennia, and likely for similar and ceremonial purposes for many millennia before that.
In sum, the Dow to Gold Ratio tells us which major asset class – industrial companies or the age-old store of wealth – is growing fastest.
History of the Dow to Gold Ratio
Below we show the Dow to Gold Ratio since inception, along with a visual depiction of the four major turnings that in the ratio that have occurred in the last 130 years:
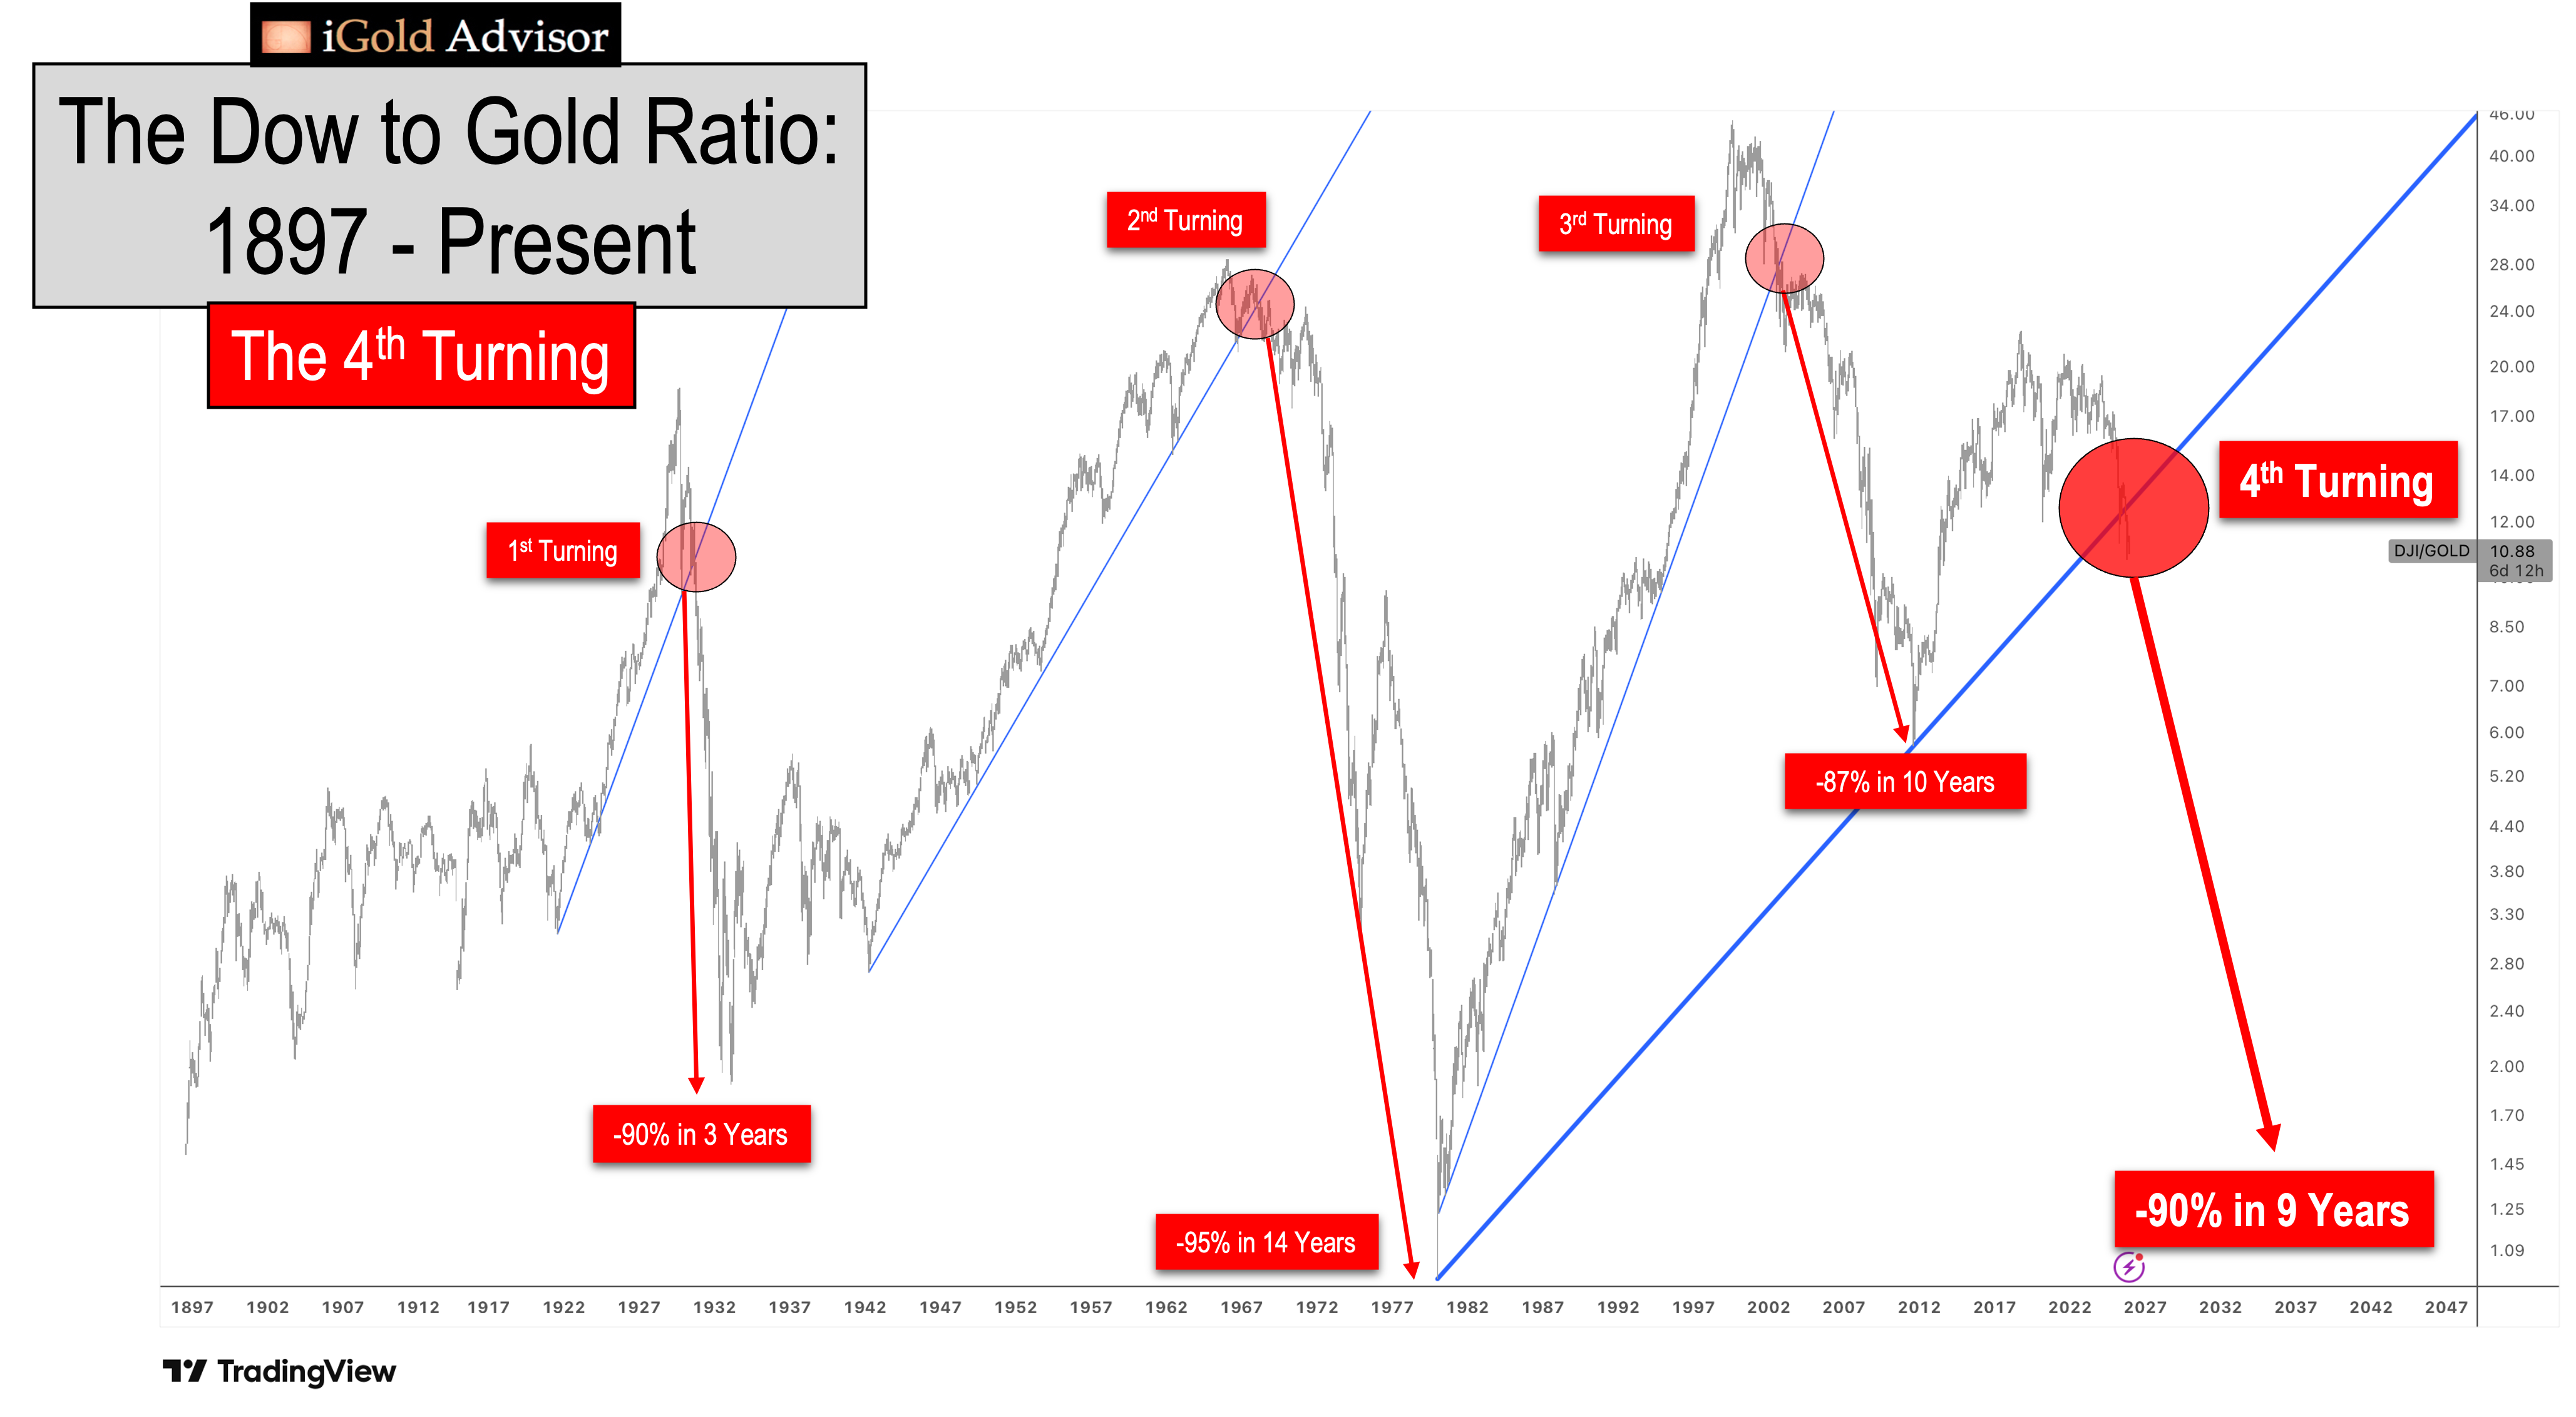
Let us discuss the three previous major turnings in the Dow to Gold Ratio, and what this implies for the ongoing Fourth Turning.
The First Turning: 1930 – 1933
In the years following the founding of the Federal Reserve (Fed) in 1913 and the post-World War I boom, the United States witnessed a near-perfect combination for industrial growth: cheap money supplied by the new central bank, and economic prosperity brought about by the post-war peace.
Yes, the Roaring 20’s, as they are now known, were in fact brought about by a combination of improving economic fundamentals mixed with a new central bank which was ready to supply the United States with freshly-printed money at its discretion.
From a level of 3.0 in 1921 up to 18.6 at the peak in 1929, the Dow gained 6.2 times (6.2X) the value of gold during the Roaring 20’s, reflecting a combination of genuine economic growth mixed in with speculative enthusiasm fueled by the cheap-money Fed.
However, nothing moves in a straight line forever, and in 1929 with lofty valuations and speculation running rampant, the stock market peaked, only to begin a secular decline which lasted for four years.
The result?
From 1929 to the low in 1933, the Dow Jones lost 90% of its value relative to gold, completely erasing the entirety of the gain seen in the 1920’s. Gold not only held its value during this time, but was officially revalued by the Gold Reserve Act of 1933 from $20 per ounce to $35 per ounce, a 75% gain.
In sum, holders of gold could buy 10X more industrial stocks in 1933 as they could in 1929. A 10X multiplication in wealth higher for gold holders in four years – this is the gain that was witnessed in the First Turning of the Dow to Gold Ratio.
The Second Turning: 1968 – 1980
The Second Turning in the Dow to Gold Ratio followed the post-Great Depression and post-World War II recoveries, which saw the ratio move from 1.9 at the start of the Great Depression in 1933 to 24.5 at its peak in 1966. Yes, over these 33 years, the Dow gained 12.9X compared to gold as the dawn of the computer age, commercial air travel, and space exploration emerged in the world. Of course, this economic growth was combined with increased debt following the unwinnable Korean and Vietnam wars, which pulled the United States into an unsustainable “Guns and Butter” paradigm in which it tried to win multiple wars overseas while simultaneously increasing domestic social and welfare programs.
It is said that countries can either focus on (a) outward aggression or (b) spending for its own citizens, but cannot effectively do both at the same time (for a prolonged period).
The result of the US attempt to do both in the 1960’s – 1970’s?
Following the Dow to Gold Ratio peak at 24.5 in 1966, rumblings began to emerge from the US’s foreign creditors that the amount of debt borrowing was unsustainable.
The US was then forced to abolish the gold standard of the US dollar set back in the Great Depression. In 1971 the US dollar became a purely fiat currency. Gold began to be freely-trading for the first time in US history.
While gold itself was revalued higher by a shocking 24-fold from 1971 to 1980 ($35 to $850), the Dow struggled and experienced several 40% - 60% corrections during this time.
The result is that the Dow to Gold Ratio fell from 24.5 in 1966 down to 1.0 at gold’s peak in 1980, with both gold and the Dow touching the nominal 850 level simultaneously in January 1980.
This means that the Dow Jones lost over 95% of its value compared to gold in 14 years.
In other words, the holder of gold could by 20X more shares in Dow companies in 1980 than in 1971.
A 20X multiplication in real wealth for gold holders in nine years. Such is the power of a turning in the Dow to Gold Ratio.
The Third Turning: 2002 – 2011
Following the PC, cell phone, and internet booms of the 1980’s and 1990’s, the Dow to Gold Ratio rose from 1 to an astonishing 45 in August of 1999. That means that the Dow Jones outpaced gold by 45X in just under two decades.
However, the speculative frenzy that resulted from the internet and dot-com bubbles in 1999 was too much to sustain indefinitely. Gold, which had been largely ignored since the 1980 peak as an archaic relic, had fallen all the way from $850 back down to $250 per ounce in 1999. And thus started the Third Turning…
The 2000’s were a tumultuous decade, witnessing the 9/11 attacks on the World Trade Center, simultaneous wars in both Afghanistan and Iraq, as well as the Global Financial Crisis from 2007 – 2009. This time, the Federal Reserve and world central banks printed money not so much to help their own citizens, but rather to bail out “too big to fail” globally-connected financial institutions, while simultaneously funding two unwinnable wars in the Middle East. [As someone who participated in both of the wars and started investing in gold in 2007 partly as a result, I can verify firsthand the unwinnable nature of those conflicts and the terrible waste of both human and financial resources that resulted].
The result of the Third Turning?
The Dow crashed nearly 60% in the Global Financial Crisis while gold was revalued from $250 to above $1,900 by 2011.
The Dow to Gold Ratio fell from 45 in 1999 down to 5.7 in 2011 – a loss of 87% for Dow Jones holders. Gold holders could buy 7.9X more shares in Dow companies in 2011 than they could just 10 years earlier.
The 2000’s was a time of immense value transfer to holders of gold from industrial stock holders.
The Fourth Turning: 2025 - ????
The Fourth Turning of the Dow to Gold Ratio in the last 130 years is now upon us.
We will repeat the chart above because its significance cannot be overlooked:

Following the 2011 peak in precious metals, AI and cryptocurrency speculation dominated the investment landscape for the next decade. Meanwhile, gold was nearly forgotten for over a decade, consolidating below the 2011 peak until 2024.
The result?
The Dow to Gold Ratio advanced from 5.7 to 22.5 in at its peak in 2018, as the industrial economy outpaced gold by a factor of nearly 4X.
However, gold was not forgotten for long. As debt problems in the United States and around the world began to accelerate, gold shot up suddenly in March of 2024, and has now more than doubled in the last two years. As this article is being written in December 2025, gold is trading just under $4,500 per ounce.
Most importantly: the 4th Turning of the Dow to Gold Ratio has officially occurred.
Note the clear break of the blue trend dating back to 1980 that has just been registered on the chart (red callout – 4th Turning).
This signal has only been registered three other times in the history of the Dow Jones vs. Gold:
- The First Turning was in 1930, and it was a prelude to a 90% decline in the Dow vs. Gold in 4 years.
- The Second Turning occurred in 1968, and it was the signal that saw the Dow lose 95% of its value vs. Gold in 14 years.
- The Third Turning occurred in 2002, and it resulted in the Dow losing 87% of its value vs. Gold in 10 years.
If we take the average of the previous three turnings, we get a 90.5% loss for the Dow over 9.3 years.
From the recent peak of 22.5 in 2018, a 90.5% decline implies a target of 2.1 for the Dow to Gold Ratio by January of 2028.
With the ratio currently trading at 10.9, the target of 2.1 still implies that the majority of the decline is ahead, as the Dow should fall more than 80% vs. Gold over the coming years.
Caution: The Above Figures Are Only Averages
Note that the above target of 2.1 by January of 2028 – representing an 80% further decline in the Dow vs. Gold – is simply an average of the previous three cycles applied to today’s prices.
There is an adage in technical price analysis that says: “The longer the trend à the more important the trend break.”
In the case of the current cycle, the Dow to Gold Ratio has just witnessed a 45-year trend break!
This is orders of magnitude larger than any of the other cycles:
- The First Turning followed a 9-year trend break in 1930.
- The Second Turning followed a 24-year trend break in 1966.
- The Third Turning followed a 22-year trend break in 2002.
The average of the previous three cycle breaks was 18.3-years.
The current Fourth Turning? 45-years. Nearly 2.5X longer than the average of all previous trends.
Again: “The longer the trend à the more important the trend break.”
The above argues that the present Fourth Turning should be the most important trend break ever witnessed in the history of the Dow Jones vs. Gold. It should see a decline greater than the average of previous cycles.
Targets for the Dow to Gold Ratio
Let us stick with the conservative 80% drop that the averages imply, back to a level of 2.1 in the Dow to Gold Ratio over the coming years.
Note that the 80% further drop is a relative decline in the Dow vs. Gold. With the Dow currently trading at 48,700 and gold at $4,500, an 80% relative decline could occur in any of the following scenarios:
Current Levels
Dow: 48,700
Gold: $4,500
Deflationary Collapse Scenario
Dow: 48,700 à 9,740 (-80%)
Gold: $4,500 à $4,500 (no change)
(In this scenario, gold holds steady as the Dow collapses 80% outright.)
Stagflationary Scenario
Dow: 48,700 à 21,000 (-57%)
Gold: $4,500 à $10,000 (+122%)
(In this scenario, gold more than doubles as the Dow loses more than 50% à net result is still an 80% decline in the Dow vs. Gold Ratio.)
Inflationary Scenario
Dow: 48,700 à 73,000 (+50%)
Gold: $4,500 à $34,700 (+670%)
(In this scenario, the Dow actually rises 50% due to inflationary pressures. Gold simultaneously rises by 670% to $34,700 per ounce à net result is still an 80% decline in the Dow vs. Gold Ratio.)
All three of these scenarios have the exact same result in purchasing power for the Dow vs. Gold: the Dow loses 80% compared to gold, or gold rises 5X compared to the Dow.
Again, remember that these scenarios are derived from the average of the previous three turnings. The 4th Turning is more than twice as long in the making as the average of the previous cycles – suggesting that the ratio could largely overshoot the 2.1 level in favor of gold over the coming years.
Key Points on the Dow to Gold Ratio
The 4th Turning of the Dow to Gold Ratio has occurred. It is plainly visible on the price charts. And price contains the sum of all information known to all market participants. The market is saying that the debt problems around the world are more significant than our ability to grow over the intermediate term.
The evidence suggests that the Dow will lose at least 80% of its value vs. gold over the coming years, or that gold will rise at least 5X versus the Dow. The net result is the same in purchasing power in either scenario.
The message of the market is that – despite progress being made in artificial intelligence (AI), medicine, space exploration, and nano-technology – the debt problems in the United States and around the world will be more important first. After the debt issues are resolved, progress for our species via technology may occur more rapidly.

Similar to the 1970’s, in which progress in personal computers, medicine, and space exploration were being made – but the debt problems were more significant imminently – technology will be progressing over the next several years even as gold largely outpaces the Dow.
However, the debt problems around the world are too significant and will need to be addressed first – this is the message of the market:
The way that world governments address debt crises in an era of fiat currency is to create money out of thin air to attempt to paper over the problems. This debases the value of the currencies and causes gold to rise, as the age-old store of wealth that cannot be debased by the whims of politicians or central bankers.
The result will be the Fourth Turning of the Dow to Gold Ratio.
This is not theory – it is visibly occurring on the charts.
How to Invest Now
Investors should be overweight precious metals, and gold and silver mining companies, now and through the conclusion of the Fourth Turning.
A generational wealth transfer lies ahead for precious metals investors properly positioned over the next several years.
A future opportunity to accumulate industrial companies will present itself in the next cycle – but only after an expected 80% (minimum) decline in valuations across Dow companies versus gold over the years ahead.
At www.iGoldAdvisor.com, we publish independent research and analysis covering all aspects of the precious metals markets. If you have found value in this analysis, you cannot afford to miss the more timely and detailed analysis that goes out weekly to our premium subscribers.
In our Precious Metals Intelligence+ service, we cover the exact timing signals for buy and sell decisions covering not only physical gold and silver, but also mining companies and other commodities (platinum, palladium, copper & oil). In our Elite Private Placements service, we offer higher net-worth individuals the chance to accumulate FREE warrants in addition to their shares in gold and silver mining companies, by negotiating directly with the company managements. One of our recent placements with a gold mining company in Canada is up over 360% in five months.
“You only need to be right once to change your life forever.” That time is now.
********
share
share
share
share
share

Christopher Aaron began his career as an intelligence analyst for the CIA and Department of Defense. He served two tours to Afghanistan and Iraq between 2006 - 2009, conducting pattern-of-life mapping for military leaders.
Mapping shares similarities with technical analysis of the financial markets because both involve the interpretation of repeating patterns found in human nature. He is the founder of iGold Advisor, providing independent research and analytics on all aspects of the precious metals markets.
He speaks regularly on the cyclical patterns found within the financial markets and on international policy. He has been featured in the New York Times and NPR news amongst other financial publications.


