Gold Forecast: Gold & U.S. Stocks, Holiday Update


 As mentioned in my last article back in late-November, Gold was looking for a short-term decline with our 10-day wave, a move which was anticipated to end up as countertrend. Stepping back slightly, another correction is coming due for the metal, also favored to end up as a countertrend affair.
Gold's 10-Day Cycle
For the very short-term, our smallest-tracked wave in the Gold market is the 10-day cycle, which is shown again on the chart below:

From my 11/30/25 article: "the next swing peak should come from this 10-day cycle in Gold, which is now some 7 trading days along - and is in the back-end of its normal topping range. In terms of price, the 10-day moving average should provide an ideal minimum magnet to the coming correction phase of our 10-day cycle, which is next projected to trough around the wide range of December 4-9."
Our 10-day cycle in Gold ended up topping the next day, following my 11/30/25 article, before turning south for the expected correction back to the 10-day moving average on its swing down. In terms of time, this wave was projected to bottom around the December 4-9 window, with its actual trough made on December 9th.

With the above said and noted, the most recent upward phase of this 10-day wave was later confirmed to be in force. In terms of time, the average rallies with this cycle, which were noted as having taken some 4-7 trading days before completing, which favored higher highs into last week - which was easily seen.
Adding to the above, this 10-day wave is now some 9 trading days along - and with that is into extended topping range. In terms of price, any reversal below the 4334.70 figure (February, 2026 contract) would infer this cycle to have turned south, a number which is expected to rise soon, with the latest reversal number always posted in our thrice-weekly Gold Wave Trader report.
Gold's 34-Day Cycle
Above the 10-day wave, there is a bigger 34-day cycle in Gold, shown on the chart below:
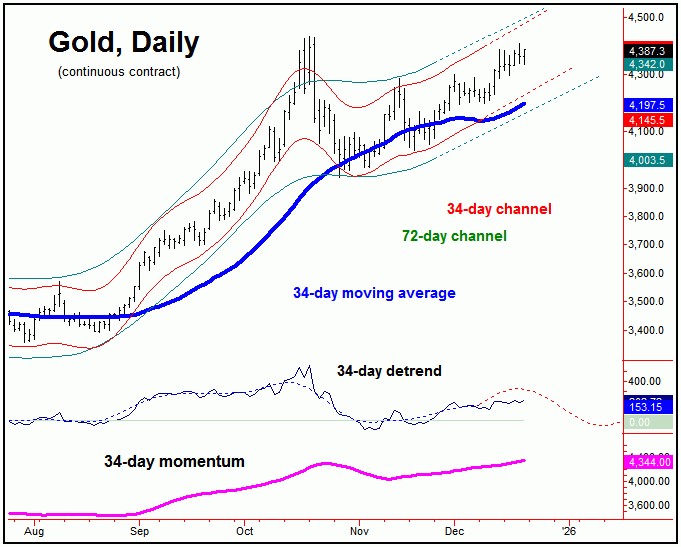
The upward phase of this 34-day cycle has been in force in past weeks, and is also into extended range for a peak. The next decent correction should come from this particular cycle, and does have the potential to peak with the current upward phase of the smaller 10-day component.
The next correction phase of this 34-day cycle should see a minimum drop back to the 34-day moving average, though with the potential for additional weakness through the same. In terms of patterns, the coming correction with this 34-day wave is anticipated to end up as countertrend, with support around the lower 72-day cycle channel.
Stepping back further, a countertrend correction with the 34-day cycle - if seen as noted - should see Gold turning back to higher highs again on its next upward phase, a rally which would likely last well into the February, 2026 timeframe. In turn, that action will be the technical setup for the next larger-degree peak for the metal.
U.S. Stock Market
From the comments made in past articles, the last mid-term low in U.S. stocks came from our 360-day time cycle, which bottomed in early-April of this year.
Here again is this 360-day cycle on the S&P 500 index:
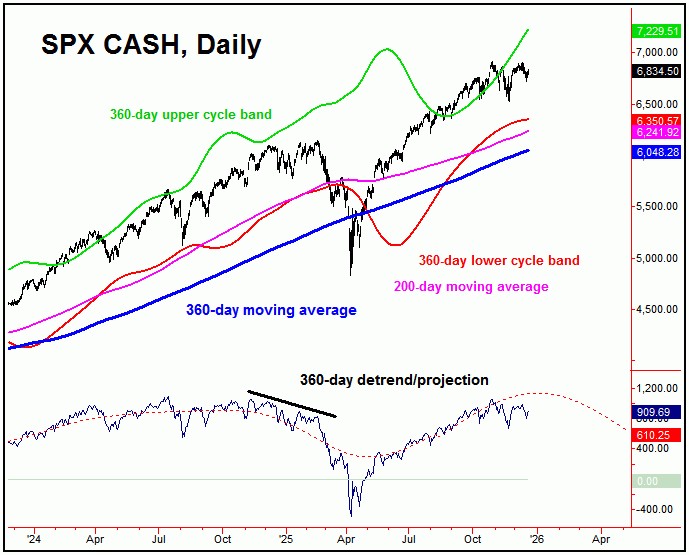
As mentioned in past articles, this 360-day wave in U.S. stocks is seen as pushing higher into the Spring of 2026, where the next larger-degree peak is projected to form. In terms of price, there is still the potential for a push up to the 7300-7500 SPX CASH region into that window - a range which, if tested, would also be key resistance.
As noted in my last article in late-November, a short-term correction was expected to play out in U.S. stocks, which we have recently seen - though expected to end up as countertrend, due to the position of our larger 360-day cycle.
With the above said and noted, once we get into the early-2026 window, we will need to be on the lookout for indications of a mid-term peak forming in U.S. stocks. One of these key indications comes from our sentiment index, which is shown on the chart below:
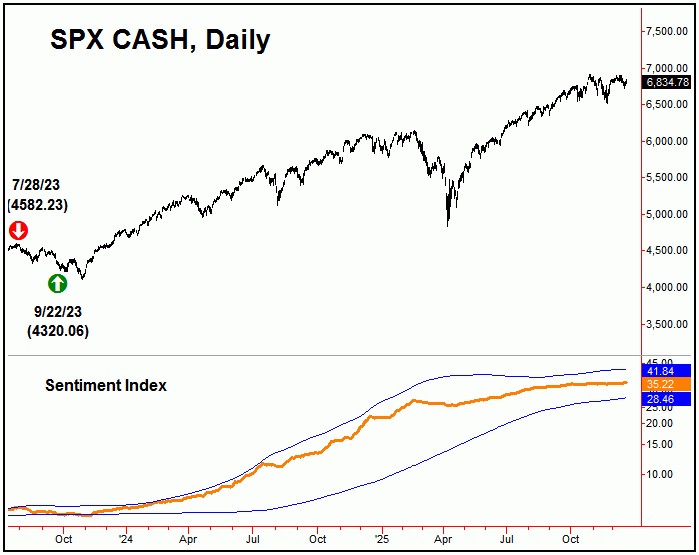
Our market sentiment index (for U.S. stocks) is currently on a mid-term buy signal, with this signal coming all the way back on 9/22/23 - doing so at the 4320.06 SPX CASH figure. It will take a push back above the indicator's upper band for a new sell signal to develop - something which will be key going forward, due to the aforementioned position of our 360-day time cycle.
The Bottom Line
The bottom line for Gold is that another short-term peak is forming, ideally giving way to a countertrend correction - to be followed by higher highs into early next year (February). As for U.S. stocks, the upward phase of our 360-day cycle is favored to hold up into the late-March to mid-April timeframe. From there, the risks will be to the downside - with a sharp decline of some 17-30% expected to play out into later next year. Merry Christmas and happy holidays to all!
Jim Curry
The Gold Wave Trader
Market Turns Advisory
http://goldwavetrader.com/
http://cyclewave.homestead.com/
********


