Getting Truth From Trading Volume


One reference book most large libraries carry is "The Dow Jones Averages; 1885 to 2010", which contains Dow Jones' authorized history of the Dow Jones Averages. We all owe Dow Jones Inc. a debt of gratitude. Since 1885, Dow Jones has made available to the public, superb market data for the cost of a newspaper.
I have charts for the Dow Jones Industrial Average using this data going back to 1885, but actually there wasn't anofficial "Dow Jones Industrial Average" until 1896, and it contained only twelve stocks. Before this (1885 to 1896), there were only the:
- DJ 14 Stock Average (1885 only)
- DJ 12 Stock Average (1886-1896)
- DJ 20 Stock Average (1889-1896)
Each of these averages contained only two industrial stocks, with the balance consisting of Rail Road shares. Rail Road companies were the 19th century's hot high-tech stocks. So, anyone who uses Dow Jones Industrial Average data going all the way back to 1885 (as I occasionally do), is omitting this fact. When using antique market data, one must use what is available, and the Dow Jones Averages from the 19th century is excellent data to see bull and bear markets from long ago.
Beginning in 1897, Dow Jones began publishing market volume, or the number of shares traded daily at the NYSE. In 1915, they also began publishing the prices for their corporate bond average.
With so many variables in the financial markets, why did Dow Jones begin publishing market volume and bond prices? To this day they still do so in this reference book, while ignoring earnings, dividends and advancing & declining data. But market volume is an excellent indication of demand, or lack of demand for stocks trading on the NYSE. And we all know that rising demand for anything results in rising prices, while declining demand results in declining prices. Keep this in mind for later on when we review volume and price trends after 2000. However, from 1900, until 2000, this relationship between trading volume and market value held true.
Publishing bond prices, if not their yields, was most likely Dow Jones' recognition that blue-chip stocks, like bonds, pay investors an income, whose rate-of-return depends on interest rate trends. Rising yields (falling bond prices) are also bad for stocks, just as declining yields (rising bond prices) are good for stock valuations. Stock valuations and bond prices (and yields) aren't bolted together, as was the case during the recent credit crisis crash. During October 2008, Treasury bond prices rose as the Dow Jones Industrials crashed below its BEV -40% line. But over the longer term they have been countercyclical.
With our current artificially low bond yields, there is no place for yields to go but up. Historically, rising bond yields (declining bond prices) have not been good for stocks. Unfortunately, the Federal Reserve and US Treasury are setting current stock and bond prices to fit their "policy models", so bond and dividend yields have lost any predictive value they once had. Here is a quote from Kevin Warsh, a former Federal Reserve official to make my point:
"Now that I am out of government, I can tell you what I really believe. Central banks are now so heavily influencing asset prices that investors are unable to ascertain market values. This influence is especially evident, with the Fed's purchase of government bonds, which has made it impossible for investors to use bond prices to learn anything about markets. -- Kevin M. Warsh: Former Federal Reserve Governor. Comments made to the Stanford University Institute for Economic Policy Research, 25 Jan 2012.
For this reason, I'm going to focus solely on stock volume in this article. Please understand that studying the markets is not like studying chemistry! Chemistry is the study of physical reactions between atoms and molecules. While with the markets, it may appear that we are only studying price movements, however price trends, unlike chemical reactions, are based upon human psychological reactions as the public's optimism of the future oscillates from extreme pessimism (bear market bottom) to euphoria (bull market top), and back down to pessimism again. Studying trading volume is still one of the best ways to gauge the animal spirits in the stock market.
Here is a Bear's Eye View (BEV) chart for daily NYSE trading volume from 1900 to 2012 (113 years). Remember, with a BEV chart, 0% (BEV Zero) is a new all-time high, or a new high for the move. What is the difference between the two? Look at the long term BEV chart for gold; its last BEV Zero (last all-time high price) occurred on 22 August 2011, while silver hasn't seen a new all-time high since 1980! Also, in a BEV chart, any data-point not a new all-time high is expressed as a negative percentage decline from its last BEV Zero.
Important Note: Tops and bottoms in trading volume * DO NOT * mark the exact tops and bottoms in market prices, but they have been reasonably close until January 2000. Since 2000, share prices and volume trends have had no relationship to reality.
In the chart below, NYSE's volume has declined 55% from its last all-time high. This is a 1930s, Great Depression decline in trading volume that tells us that the demand for shares trading at the NYSE has evaporated. Yet the Dow Jones, and other major indexes are still within 5% to 10% of their last all-time highs!
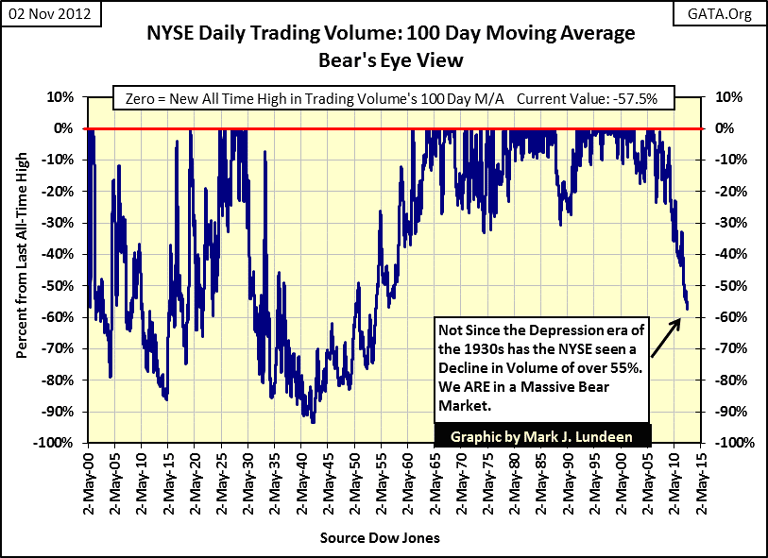
In the BEV chart shown above, before 2000, it's been a truism that the best time to enter the stock market is when volume has bottomed, and once again begins climbing. This was because at the bottoms in this BEV chart, trading volume (demand for stocks) has bottomed, as have stock prices. These bottoms in volume exemplify a situation where selling pressures have for the most part exhausted themselves, and stock prices are most likely near their bear market hard bottom too. As trading volume (demand for stocks) returns, stock prices once again begin to rise. But sometimes it's not this simple; this process took ten years from 1932-42. No market indicator is 100% reliable; still market volume is a good thing for investors to be aware of, as a method to gauge a market's bottom.
I wouldn't be human if I didn't wonder why trading volume from 1900 to 1942 frequently declined over 70% from bull market top to bear market bottom, yet after 1942, those massive declines in volume stopped. This must be because President Roosevelt stepped up Federal Government regulation of the financial markets at the bottom of the Great Depression bear market. Shame on me; I really do think the government should have a role in the markets! I actually like much of what Roosevelt did: the uptick rule for shorting the market and the Glass Steagall act that separated commercial and investment banking were brilliant acts of legislation. Had future legislators left it at that, I'd have a much more favorable opinion of having "regulators" interfering in the markets. As Federal Regulation is now, it's just another major market scandal that will one day become public knowledge.
Since the 1930s, lobbying efforts by Wall Street have changed the rules that made investing a fair game for the little guy. However, there are always a big league "economists" who willingly prostitute themselves for the big banks to argue the cause of Wall Street before clueless members of Congress on the need to change this or that, usually in the name of making "markets more efficient."
The best thing that Congress could do today would be to expunge all post 1930's regulatory legislation, and once again institute the legislation that Joseph P. Kennedy (of all people!) crafted for President Roosevelt many decades ago - with no changes. There is no chance of Washington doing this now, as few federal politicians can now finance an election campaign without Wall Street's generosity. But when things again become very scary, as they did in 2008, Congress may see the wisdom of throwing Wall Street to the wolves to save themselves, and finally decide, for once, to do the right thing, like expunging all post 1930's market-regulatory legislation, and again institute the legislation that Joseph P. Kennedy (of all people) crafted for President Roosevelt many decades ago.
Also, I'd force brokerages to live on their trading commissions. A 5%, or 6% round trip for a trade by retail and commercial traders seems a reasonable price to prevent your counter party from being Goldman Sachs or JP Morgan. For the sake of the survival of our Western Civilization, hedge funds and brokerages should be forced to return to the high tech trading platforms of the 1980s. For the purposes of institutional trading, an old fashion Intel 386 microprocessor, using only 1 megabyte of memory, and running on DOS 5.0, or an older DOS version would do the job nicely. Any more than an Intel 386 and 1 megabyte of memory would only tempt the Wall Street's proprietary desk traders to fleece the public again. Oh yeah, they can trade electronically, but they would have to use a phone modem with no more than 56K data transfer rate. High-Frequency traders? Trade with that, you bastards!
BEV charts are indispensable for long term data sets that span decades. But to get the best grip on data that spans only a decade or two, charting actual data, as is, can be a superior graphic. Regular charts display actual peak values, and not 0%'s for each new all-time high. Below I've charted the Dow Jones Total Market Group's (DJTMG) total market trading volume since 1989. The swelling trading volume so obvious during the 2000-03 market's decline would not be displayed in a BEV chart. Ten years ago, the Dow Jones declined 38% during a period when trading volume exploded to historic levels! Since 1900, this had never happened before. Note also that the DJTMG volume data, exactly like the NYSE volume, shows exactly how the Dow Jones rebounded 100% after the March 2009 credit-crisis lows; on plunging trading volume! If you've ever wondered whether the stock market is manipulated by the Federal Government, here is absolute proof that it is.
I may not be a physicist, but I know what matters! -- Popeye
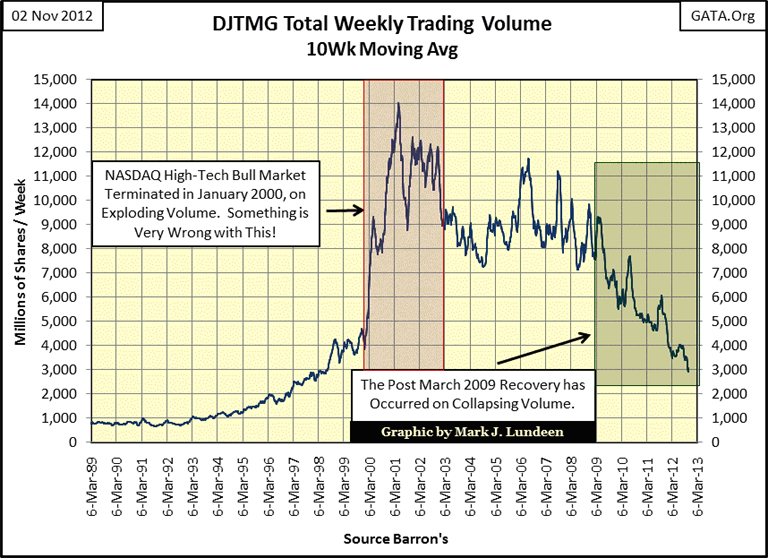
Since 1900-2000, trading volume has provided investors insight on rising and declining demand for stocks. Today, its only use is to warn investors that the good-times are only going to last as long as the US Government can subdue the free market forces that will eventually overwhelm the "policy makers' economic models", and take our financial markets down hard. In my opinion, when the dam built by the "policy makers" ultimately breaks, the Dow Jones has a damn good chance of breaking below its percentage declines of July 1932 (-89%). This decline in volume is actually worse than it looks, as 50% to 75% of daily volume is from high-frequency traders scalping retail investors for nickels and dimes.
All this is nice to know, but what makes DJTMG's volume really useful is that its total trading volume is the sum-total of the 72 individual market group's volume. This allows us to calculate each of these groups' volume as a percentage of total volume, and plot their changing percentage's claim to total volume over time. Let's start with DJTMG's semi-conductor and software volume.
Not much to say as once you understand what these plots represent. But some comment is justified, like noting that in 1989, both these DJTMG indexes' contribution to DJTMG's total volume was only about 4%. This means that the other 96% of total volume was taken up by the other 70 indexes.
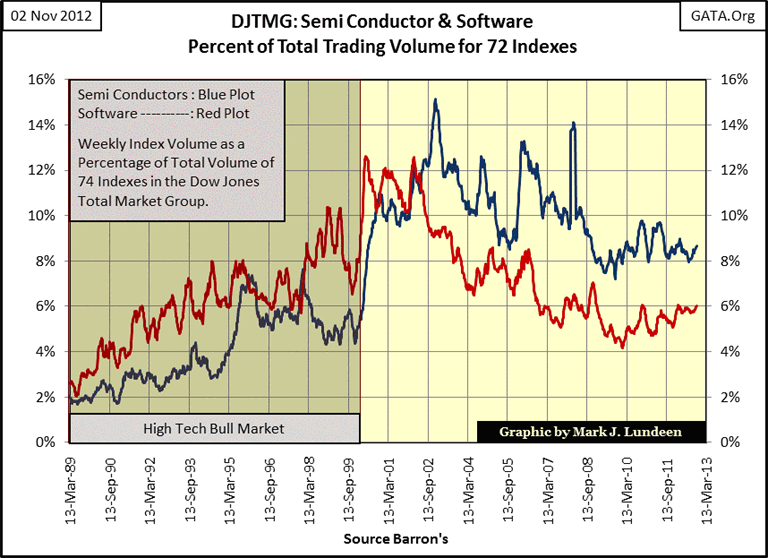
Above, we see exactly how the high-tech bubble developed from 1989 to 2000; these two indexes' trading volume increased from 4% of total volume in 1989, to over 21% of total trading volume in January 2000. In other words, in 1989, 1 of every 20 shares traded in the stock market was a high tech share. But shortly * AFTER * the high-tech top in 2000, 1 of every 5 shares traded in the stock market was a semi-conductor or software share as these indexed collapsed in price.
Here's a chart showing the percent of total volume for the entire DJTMG's Technology index, which includes the two groups above.
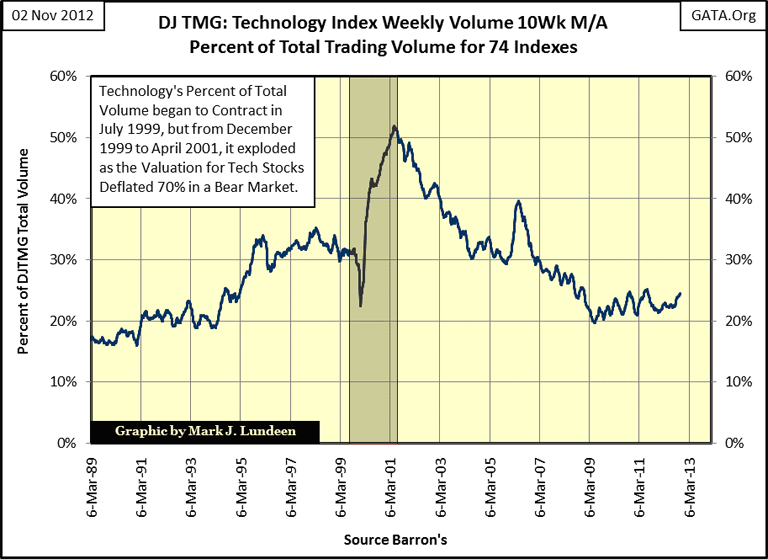
The shaded area above is very suspicious. High tech's percentage of total market volume began contracting in July 1999. By December, the high tech's slice of total market volume was reduced from 30%, to about 23%. This percentage reduction was a very predictable reaction in trading volume as a major bull-market in the tech shares approached its termination. However, as the DJTMG's Technology index began declining in a massive bear market that saw an 82% collapse in valuation (see BEV Chart below), their slice of total volume increased to over 50% of the total weekly volume. Incredibly, 1 of every 2 shares traded in the stock market were high tech stocks, as the high-tech index crashed in a grizzly 82% bear-market decline.
Oh, give me a break! Only lunatics spending their own money, or bureaucrats funded with "liquidity" from the Federal Reserve would increase their exposure to an asset class in the process of crashing 82%! Compare the charts above and below to see my point!
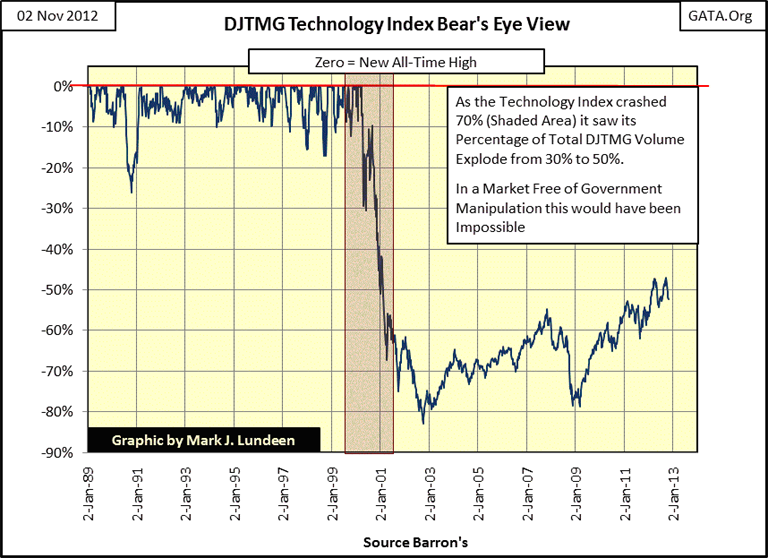
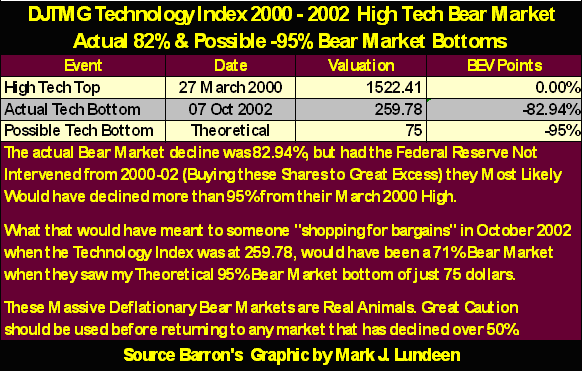
Had the "policy makers" not interceded in the 2000-02 high-tech crash, by purchasing what EVERYONE ELSE WAS DUMPING AT ANY PRICE, the DJTMG's technology index may have fallen below its BEV -95% line. For people who bought at the March 2000 top, this is only an additional 12 BEV points from its last all-time high. But for someone who was "shopping for bargains", buying these "Cheap Shares" at the BEV -82% bottom of 259.78, would have seen a 71% loss had the high-tech bear market hit a BEV -95% bottom of only 75. See table below.
And all this happened as the retail investors' watch dog (the financial media) sought interviews from Alan Greenspan (the man most responsible for inflating the high-tech shares in the first place) and CEO's of the large Wall Street banks who pushed these dogs on the gullible public. If the financial media were worth a damn, the media would have taken Alan Greenspan's subliminal plea for help seriously when he wondered if the market was smitten with "irrational exuberance" years before the high-tech top. I know they can't do that now, but they could demand an answer from the US Department of Justice on exactly why insurance companies, pension funds, and the general public keep losing a few trillion dollars every now and then. They could also give the G-men a hint by pointing a finger at the Federal Reserve and Wall Street. But they never do, so I have little good to say about them.
Since 2001, we see the former hot high tech shares have remained relatively dear to the market; 20% of total market volume. But high-tech's claim on total volume has declined, and should continue declining until the Mr Bear is finished with the stock market. This means that money previously in the high-tech sectors has departed and flowed somewhere else in the DJTMG.
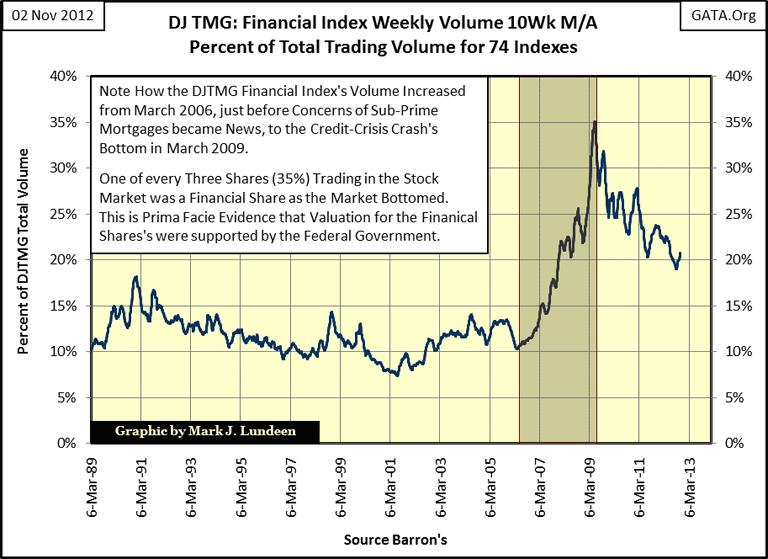
As the mortgage bubble began inflating in 2001, some of that high-tech bubble money flowed into the DJTMG's financial index as seen in the chart below. And just as the high-tech bubble inflated, and popped, we also see how the mortgage market began to inflate, as seen in the DJTMG's Financial Indexes' volume. We can also see the reaction to a market crash in a CNBC favored-market sector; as with the high-tech index, the financial shares' percentage of total market volume exploded, going from 1 in every 10 shares of total volume, to 1 in 3 shares of total market volumeduring a massive decline in valuation.
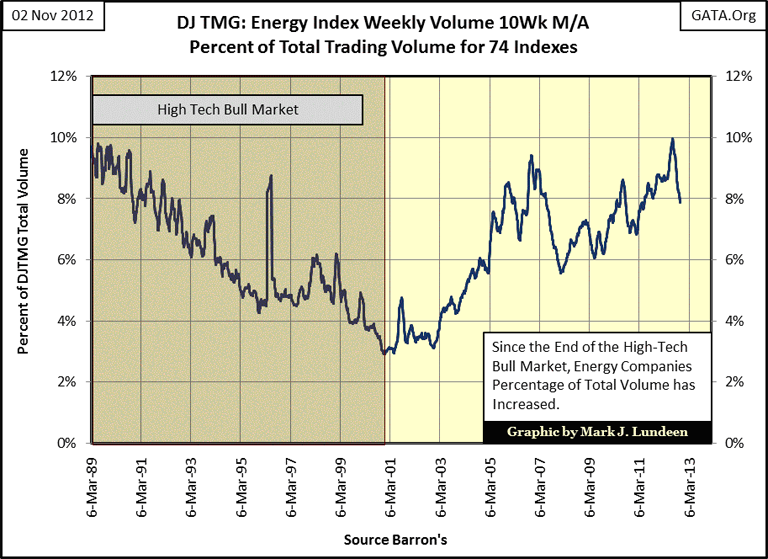
The current media obsession with the financial and high tech sectors won't last forever, and we should anticipate which indexes in the DJTMG are going to benefit from the decline in the market's current favorites. So let's take a look at the DJTMG's Energy Index. As expected, their contribution to total market volume from 1989-2000 declined as the world was investing in the high tech future of the 21st century. Well, we've seen the first twelve years of the high-tech 21st century, and it hasn't been so great. It's not just me thinking this; look at the rising percentage of total volume in the energy index.
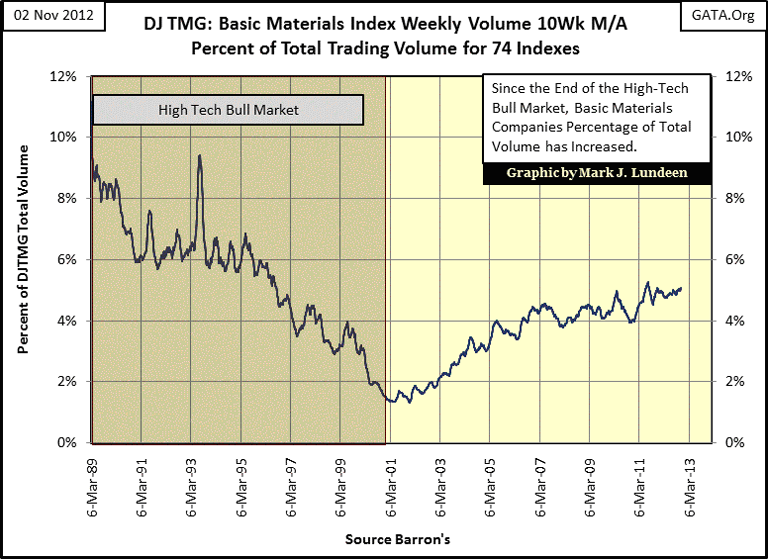
Below, we see the same story in the basic material stocks. Like energy, since 2001 basic materials have increased their percentage of the DJTMG total volume.
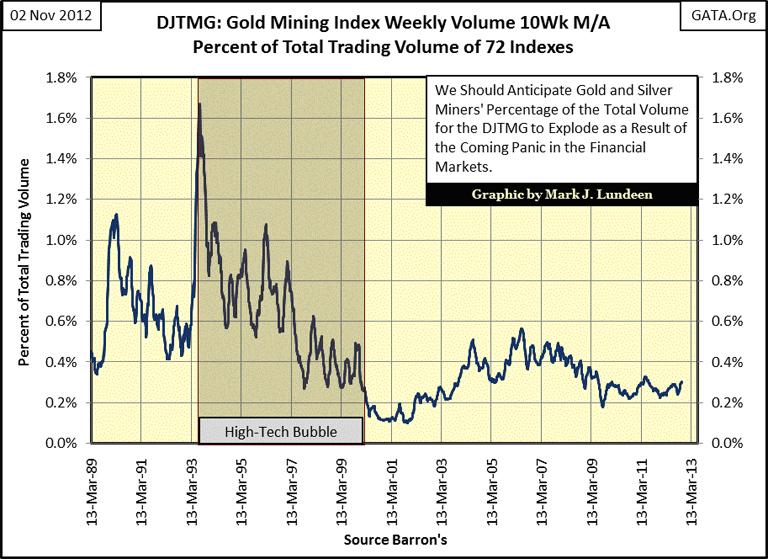
Let's look at the gold mining shares, a subgroup of the basic materials index. The high-tech bubble was hard on gold mining's slice of the total-volume pie; but that is now over. We can expect the gold miners' percentage of total volume to greatly increase dramatically when the favored groups of the 1990 (high tech and financials) are finally allowed by Washington to deflate, and gold, silver and mining shares return to the publics' attention.
I note too, that not everyone rushed into the mortgage bubble, as we see in the table below. It really was the "smart money" that bought the gold, silver and the precious metals miners in 2001! But if you're getting your free investment advice from the financial media, who to this day either ignores, or warns investors not to invest in the top performing market sectors of the past eleven years, your performance is somewhere below 50 in the list.
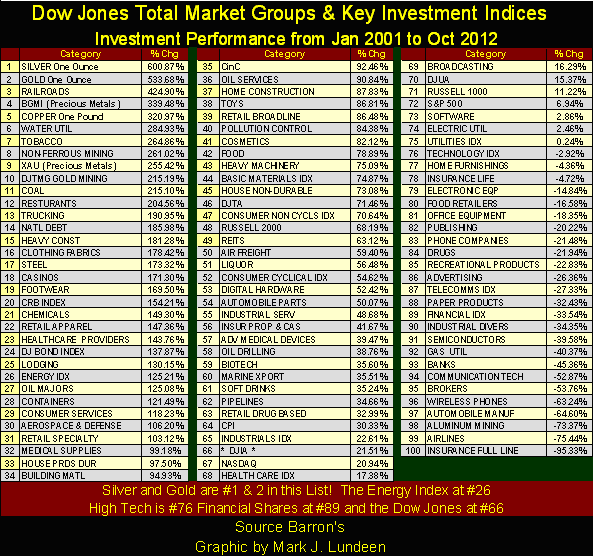
I anticipate that the current volume trends will continue for years to come. And as long as the DJTMG's basic materials and energy indexes continue to expand their positions in total market volume, and high-tech and financial indexes continue to see their percentage of total volume contract, gold, silver and mining shares will continue to be the place to be.
Mark J. Lundeen
[email protected]
[email protected]
More from Gold-Eagle


