Gold’s Short To Medium-Term Outlook Deteriorated Substantially Last Week


While the long-term outlook for gold could hardly be better. However, the short to medium-term outlook deteriorated substantially last week…with an important chart reversal on Thursday that was not negated by Friday’s bounce back. Moreover, the latest COTs coming in are very bearish with record readings. Furthermore, the $5,000 an ounce gold crowd are hawking their wares more aggressively than ever! It’s not they are necessarily wrong, it’s just that they are naturally most vocal at tops, when they can suck in the most hopefuls.
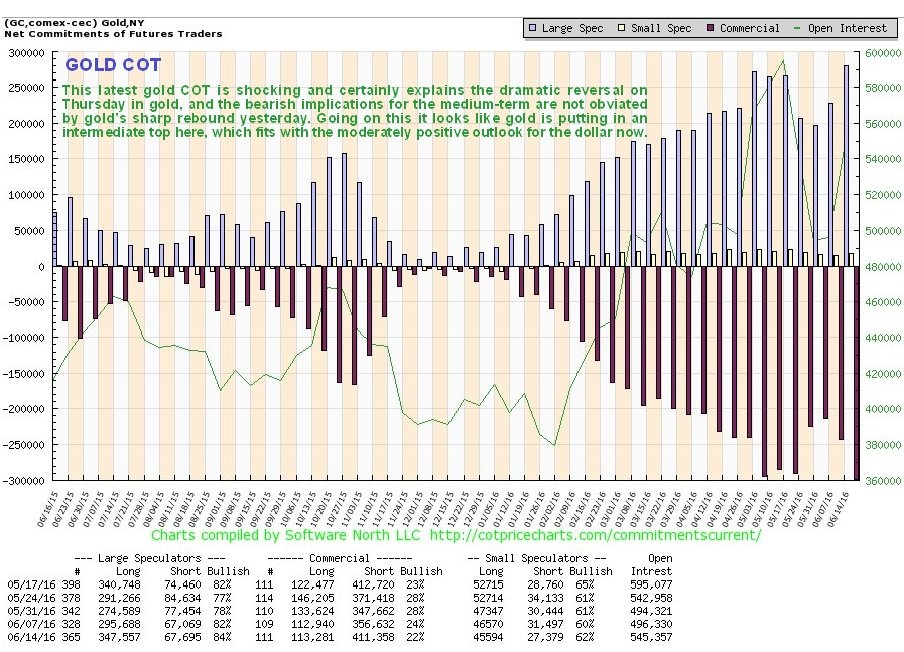
As you may know, we have not been raving bullish on gold in recent months, largely because of the off-putting COT structure. And this was not an unreasonable stance given that gold has only risen by about $20 from its early March highs as we can see on its latest 6-month chart below. Last Thursday was an important day for gold; in the early trade it advanced to new highs, but reversed violently intraday to close well down on the day on high volume, leaving behind a classic “shooting star” reversal on its chart. As we can see it didn’t reverse where it did by chance – it reversed right at the restraining upper boundary of the pattern that has formed over the past several months – and it is now becoming increasingly clear that this pattern is a flat-bottomed broadening formation. These patterns are normally bearish in purport, although the price sometimes leaps out of the top of it and spikes before reversing and dropping hard. This interpretation is supported by the latest COTs, which look horrendous, it has to be said, which we will now take a look at.

The latest COTs show a dramatic surge in Commercial short and Large Spec long positions over the past two weeks to new record extremes. This is viewed as an outright bearish setup, especially given the price pattern that we have observed on gold’s chart above. And Friday’s bounce is viewed as providing the valiant and experienced trader with an ideal shorting setup.
Click on chart to popup a larger clearer version.
The latest Hedgers chart shows positions now at a wild bearish extreme, and remember, this is not my interpretation – it is the cool and objective interpretation of www.sentimenttrader.com who are responsible for the red bearish dotted line on this chart. If you are a trader long the sector…and are not worried by this, then I am sorry to say it, but you are a fool.

Click on chart to popup a larger clearer version.
Chart courtesy of www.sentimentrader.com
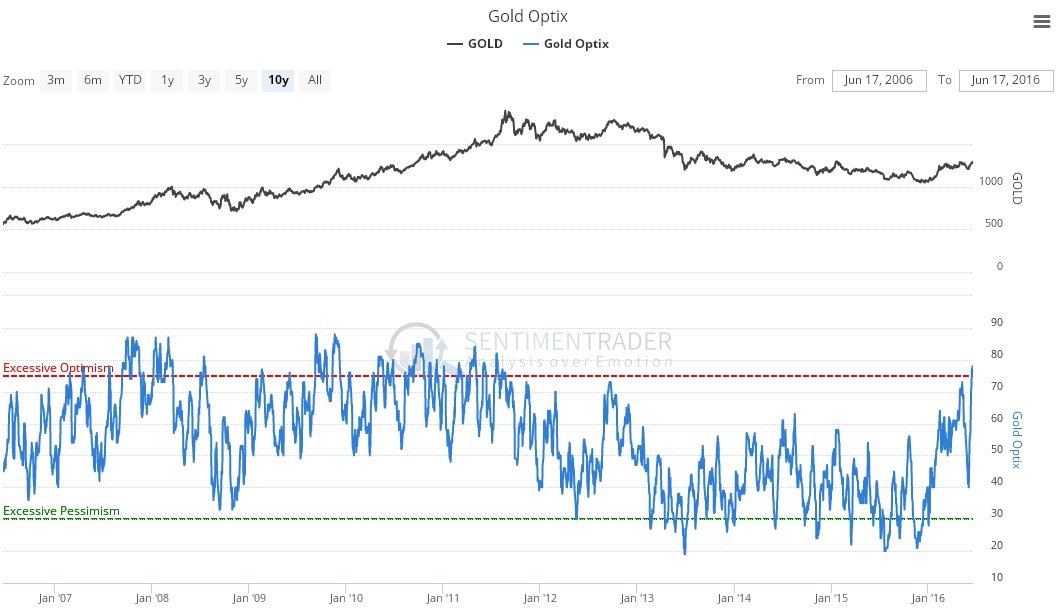
The latest gold Optix, or optimism chart, likewise sounds a warning bell, with optimism spiking to an extreme reading that has immediate bearish implications.
Click on chart to popup a larger clearer version.
Chart courtesy of www.sentimentrader.com
What would be the most likely cause of a drop in the price of gold soon? Why of course it would be as ever, a rally in the US dollar. What are the chances of the dollar rallying? – pretty good actually, as we will now see.
On the 3-year chart for the US dollar index we can see that it has stabilized above strong support towards the lower boundary of a giant rectangular trading range with a potential base pattern forming in recent months.

On its 6-month chart it looks like the dollar index may be working on completing the Right Shoulder of a Head&Shoulders bottom. If so, a sizeable rally is brewing.

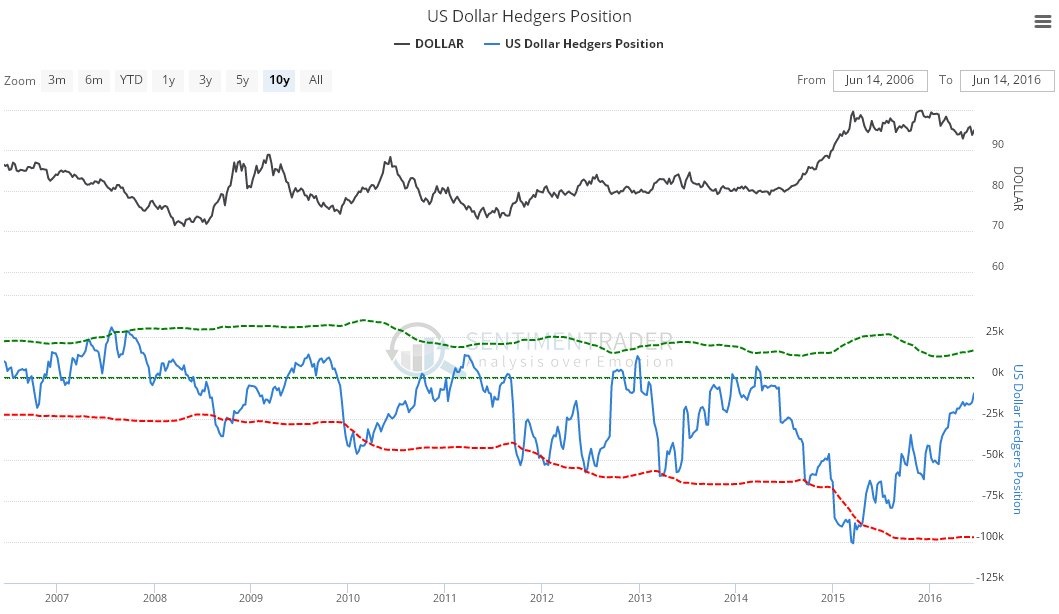
The latest US dollar Hedgers chart makes for interesting viewing. This chart shows that Hedgers’ positions have been steadily improving since the dollar peak over a year ago, following the strong runup, and they are now closing in on being outright bullish – and we should note that the dollar doesn’t have to wait for that to happen to start rallying.
Click on chart to popup a larger clearer version.
Chart courtesy of www.sentimentrader.com
While the latest US dollar optix chart shows readings still in middling ground, they are on the bullish side of middling.

Click on chart to popup a larger clearer version.
Chart courtesy of www.sentimentrader.com
Why should the dollar rally after suffering so much abuse at the hands of the Fed and big banks in recent years? Important reasons are not hard to find. In the first place, the Fed may have been abusing the dollar, but most of the rest of the world has now followed suit, with many Central Banks around the world striving to outdo the Fed. The European Union and Japan in particular have evolved into masters of outdoing the Fed. Another big reason is that global markets are now in the late bubble stage, and this includes bonds, stocks and Real Estate, and are increasingly unstable, so that various “black swan” events could trigger a general crash, like the Fed stubbornly raising rates later this year in the face of an already crumbling economy. Finally, like it or not, the US dollar remains the global reserve currency, and US elites intend to keep in that way, as Russia is now finding out at the point of a gun.
If you agree with what is set out here, then what options are open to you? These are many and various depending on your personal situation and current investments. If you have done well out of the recent sector rally you should consider taking all or partial profits, or hedging with options. If you are a latecomer you should beware of getting sucked in at this stage, this is especially the case given that many investors already appear to have forgotten just how fast this sector can drop when sentiment changes. If you are an experienced trader who has just turned up on the scene you may want to consider taking advantage of the current setup by shorting the sector using inverse ETFs or options.
A final important point is that if the Brexit vote results in Britain leaving the EU, it could potentially unleash a financial tsunami that sees markets crash and gold, silver and other commodities taken down as the dollar soars. It is impossible to say which way this vote will go. The ordinary voting public are being subjected to heavy and relentless and also carefully contrived propaganda by the mainstream media, who are controlled by the elites who are obviously pro the European Union and it remains to be seen whether they can be herded like sheep into voting in the desired manner, as the Scots were, when they succumbed to scaremongering about the consequences of becoming independent. Europe is falling to bits, evidenced by the dead-end desperation of negative interest rates which itself is sluicing capital into dollar denominated investments, and Britain leaving will only hasten its demise, as other countries will be emboldened by this and want out too, so it’s small wonder that the dollar index would soar as it is comprised about 57% of the euro.
It is understood that this update will not exactly make me popular with goldbugs, but I am more interested in trying to be right than popular.
Courtesy of http://clivemaund.com/

Clive P. Maund’s interest in markets started when, as an aimless youth searching for direction in his mid-20’s, he inherited some money. Unfortunately it was not enough to live a utopian lifestyle as a playboy or retire very young. Therefore on the advice of his brother, he bought a load of British Petroleum stock, which promptly went up 20% in the space of a few weeks. Clive sold them at the top…which really fired his imagination. The prospect of being able to buy securities and sell them later at a higher price, and make money for doing little or no work was most attractive – and so the quest began, especially as he had been further stoked up by watching from the sidelines with a mixture of fascination and envy as fortunes were made in the roaring gold and silver bull market of the late 70’s.
Clive furthered his education in Technical Analysis or charting by ordering various good books from the US and by applying what he learned at work on an everyday basis. He also obtained the UK Society of Technical Analysts’ Diploma.
The years following 2005 saw the boom phase of the Gold and Silver bull market, until they peaked in late 2011. While there is ongoing debate about whether that was the final high, it is not believed to be because of the continuing global debasement of fiat currency. The bear market since 2011 is viewed as being very similar to the 2-year reaction in the mid-70’s, which was preceded by a powerful advance and was followed by a gigantic parabolic price ramp. Moreover, Precious Metals should come back into their own when the various asset bubbles elsewhere burst, which looks set to happen anytime soon.
Visit Clive at his website: CliveMaund.com


