Gold And Silver Interim Updates


You will recall that last Wednesday a warning was posted before the open that gold was about to break sharply lower from a bear Flag, which it did the very next day, so you had a full day of trading to prepare, either by exiting positions, placing stops or purchasing inverse ETFs or Puts, and I was pleased to learn that some of you did just that. As we can see on gold’s latest 8-month chart below, the 3-wave A-B-C pattern is targeting the $1240 - $1250 area.
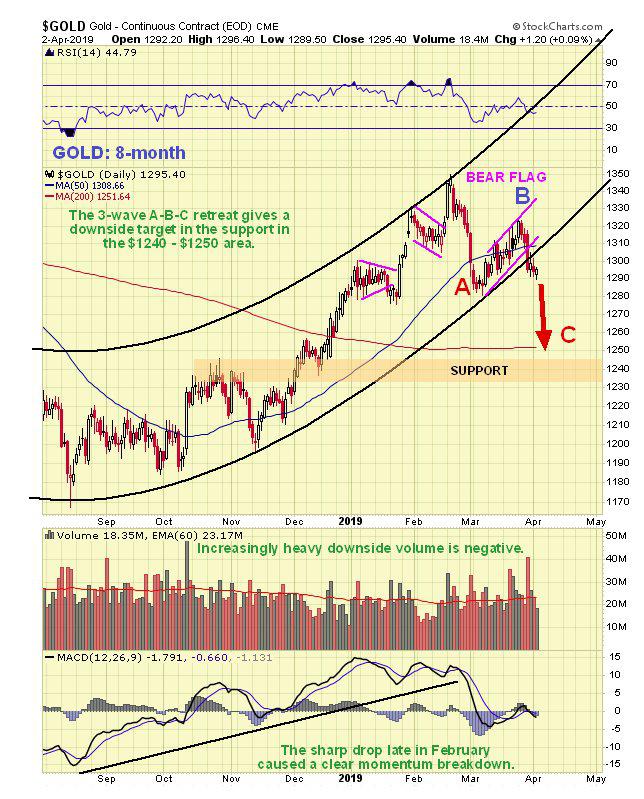
But there is another way of looking at it. Gold (and silver) now appear to be close to breaking down from Head-and-Shoulders tops, with this pattern shown on the same 8-month gold chart below. If a true H&S top is forming in gold, and the recently bearish volume pattern suggests that it is, then the minimum downside objective following a breakdown is a $70 drop from the neckline of the pattern, which gives us a target at about $1220.

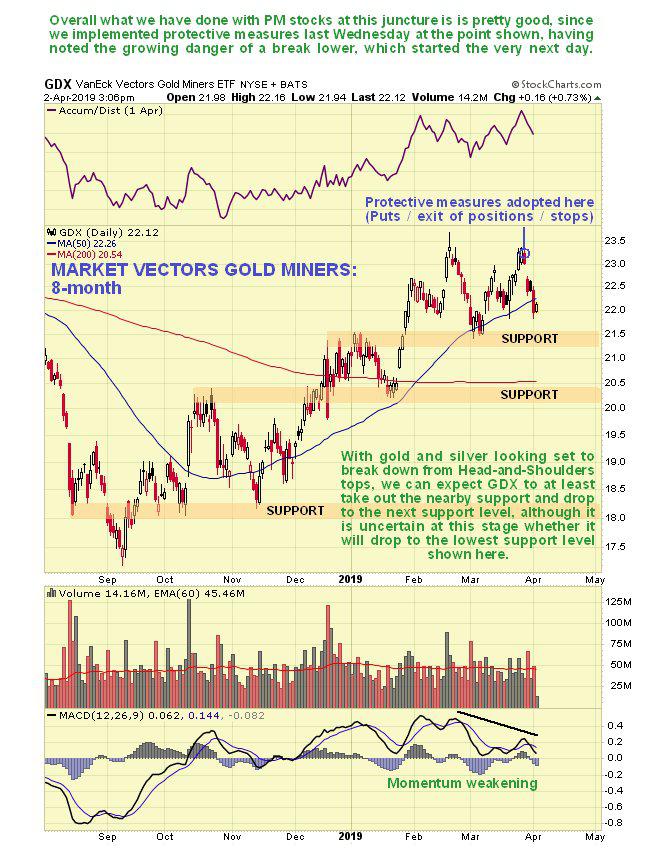
Such a drop will of course inflict further damage on PM stocks. How much damage it is not so easy to say looking at the 8-month chart for GDX below, but it seems likely that it will crash the nearby support level shown and drop to the next support level in the $20 - $20.50 zone, and it is unclear at this stage if this support will hold or whether it will breach it and drop further towards the lowest support shown on this chart.
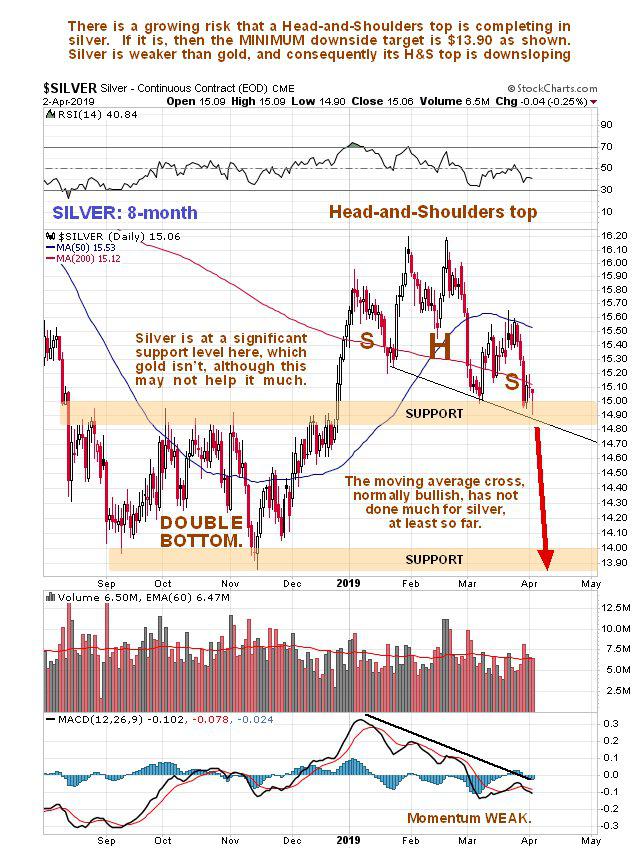
Silver’s chart remains weaker than gold’s, which is normal at this stage in the cycle, which explains why on its latest 8-month chart that a downsloping Head-and-Shoulders top has formed in it. It is currently at a significant support level which gold isn’t, but that is unlikely to spare it further losses if gold drops as it looks like it is set to.
*********

Clive P. Maund’s interest in markets started when, as an aimless youth searching for direction in his mid-20’s, he inherited some money. Unfortunately it was not enough to live a utopian lifestyle as a playboy or retire very young. Therefore on the advice of his brother, he bought a load of British Petroleum stock, which promptly went up 20% in the space of a few weeks. Clive sold them at the top…which really fired his imagination. The prospect of being able to buy securities and sell them later at a higher price, and make money for doing little or no work was most attractive – and so the quest began, especially as he had been further stoked up by watching from the sidelines with a mixture of fascination and envy as fortunes were made in the roaring gold and silver bull market of the late 70’s.
Clive furthered his education in Technical Analysis or charting by ordering various good books from the US and by applying what he learned at work on an everyday basis. He also obtained the UK Society of Technical Analysts’ Diploma.
The years following 2005 saw the boom phase of the Gold and Silver bull market, until they peaked in late 2011. While there is ongoing debate about whether that was the final high, it is not believed to be because of the continuing global debasement of fiat currency. The bear market since 2011 is viewed as being very similar to the 2-year reaction in the mid-70’s, which was preceded by a powerful advance and was followed by a gigantic parabolic price ramp. Moreover, Precious Metals should come back into their own when the various asset bubbles elsewhere burst, which looks set to happen anytime soon.
Visit Clive at his website: CliveMaund.com
More from Gold-Eagle


