Gold And Silver Volatility: 1969-2012


Let's take a historical look at daily volatility in the old monetary metals from the early days of the 1969-80 bull market to the present. Doing so, we'll gain a unique insight into the current bull market in gold and silver, as there are some very interesting things to note for gold and silver in the early 21st century.
Below contains a table listing the performance for gold and silver from 1979 to 2012. Note that 2012 gold and silver prices are based on the close of 19 December. With five trading days to go, data for 2012 is not definitive, but is close enough to assume that both gold and silver will have another up year. Also note that I skipped ten years in the data in the table below, from 1980-89. Everyone knows that in 1980 gold rose above $800, and silver saw $50, but silver never closed above $50, and the bull market peaks in both gold and silver occurred during an astounding seven trading-day buying panic (14-21 January 1980), after which precious metals prices dramatically collapsed into a twenty one year bear market.
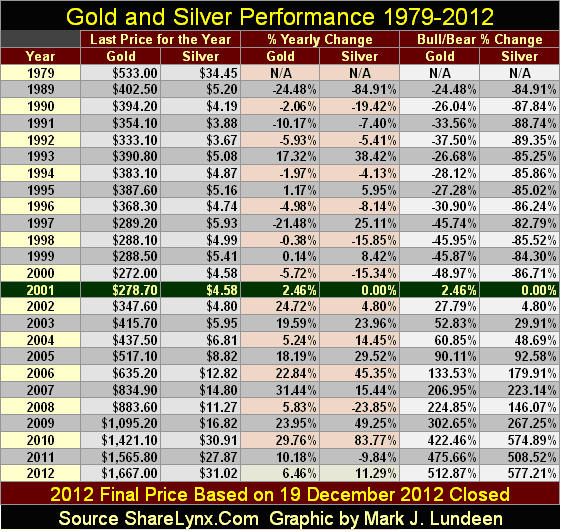
2001 was the turning point, when a twenty one year bear market terminated, and a twelve year (so far) bull market for both gold and silver began. Amazingly, gold has yet to see a down year since 2001, and the same would have been true for silver if the "policy makers" had not whacked the precious metals market down in 2008 & 2011. Note too that I listed not only the percentage gain for each year (% Yearly Gain column), but also the growing losses for the 1980-2001 bear market, plus the accumulating gains for the 2001-2012 bull market in the "Bull/Bear % Change" column. All percentages (except for 2012) are based on the yearly closing prices given in the table.
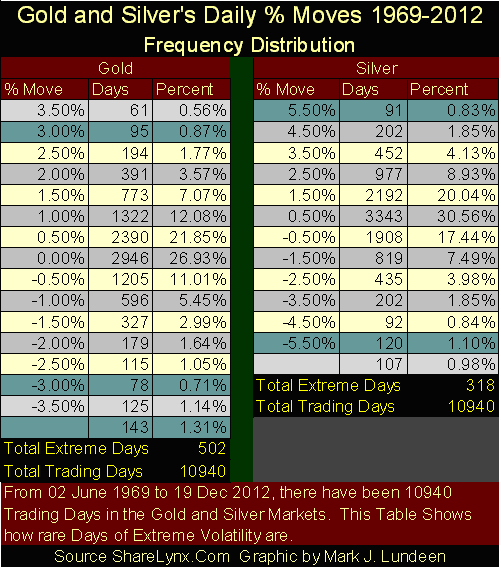
However, there is more information available in a market than just prices, like how many days of extreme volatility gold and silver have seen from year to year. For the Dow Jones, I use any day where the Dow Jones moves +/- 2%, or more, from its previous day's close as a day of extreme volatility. With gold I use a +/- 3% day, and 5.5% days for silver. Whenever the Dow Jones, or the old monetary metals see a change in their yearly frequency of their extremes in their daily volatility, something important may be occurring in the market that is not readily unapparent. In the table below, days of extreme volatility for the past forty-three years (1969-2012) are highlighted in light and dark blue rows. In the 10,940 trading days since 1969, days of extreme volatility are rare market events.
My next table lists not only the total days of extreme volatility, but also how many positive and negative days of extreme volatility occurred in each year. Note the frequent occurrences of extreme days from 1973-82. This period of market history includes the 1969-1980 bull market, and the first three years of the 1980-2001 bear market.

The gold bull market of the 1970s was a wild ride for anyone risking money in the gold market, as evident below. When the price of gold declined 40% in March 1980, who could say with certainty that the bull market was over? Because of the extreme corrections from 1974 to 1980, I'm convinced that most gold and silver bulls ultimately lost money with their gold and silver investments, as they stayed too long at the party. The most likely reason frequent days of extreme volatility continued occurring until 1983, is that many people had reasonable expectations to hold on for higher prices in the first few years of a massive bear market. Fortunately for us, our gold bull market has been a real pussy-cat of a bull, that 99% of the investing public has completely missed - so far.

Going back to the table above, look at my "% Range" columns; these values list the percentage movement for gold and silver using the high and low price for that year. The %Range is always a positive value, even during down years. The %Range informs us of which years saw large or small moves in the price of precious metals. It seems a rule of thumb that the best years to buy gold and silver are during the smaller %Range years. Since 2001, these smaller %Range years also are the years when pessimism takes hold of those gold bulls who believe any year that doesn't see plus 30% increase in their metal is a reason to lose sleep - but that isn't true! I see our current %Range of only 16.53% as a promise of excellent gains in the year to come. I don't mean to offend, but to those who are upset because 2012 didn't meet your +30% expectations, you just have to get a grip on yourselves. Geeze Louise, seeing gold's second worst year since 2001 with a 16% range looks pretty darn good to me!
The next two charts, plotting Total Days of Extreme Volatility, are the most valuable graphics of this article, as they illustrate that since 2001, something has been missing in our bull market for gold and silver: Days of Extreme Volatility that were so common during the bull market of the 1970s. In the chart for gold, it's very evident how our gold-bull market differs from the bull of the 1970s. Looking at the chart below, it's hard to argue that gold now trades in a free market in our current era of unceasing quantitative easings and central bank admitted bond yield rigging.

What is key with central bank leasing or swapping their monetary-gold reserves is that thousands of tons of their gold reserves have been sold into the open market to suppress the price of gold from the Clinton presidency to now. Their motivation for doing so is easy to understand; rising gold and silver prices are a failing grade for their paper currencies. This has resulted in a disturbing situation where the central banking system now holds only pieces of paper, promising the return of thousands of tons-of-gold from commercial and investment banks. These are the same Wall Street banks (all the usual suspects) that these same central banks had to bail out in 2008-09. This is so bizarre; and dangerous!
Unfortunately for high-finance, it's doubtful that the beautiful women of Asia, who now own this gold, are willing to return their jewelry to JP Morgan and the other bullion banks. These dark-eyed beauties purchased much of this gold during a time when it sold for less than $600 an ounce, years ago. With gold now selling for over $1700, these banks simply can't obtain the tonnage of gold necessary, at a price that's acceptable, to make good their gold obligations to the US or Germany's Treasury. Most of the gold once held by the western central banks might very well be gone.
If since 2001, gold has seen so few days of extreme volatility as it appreciated 640%, or why banking insider, the former Goldman Saks CEO Jon Corzine, who absconded with $1.5 billion from MF Global's clients, is now above the law, you need look no farther than these documents published by GATA I've linked above. Selling official-reserve gold is why the 2001-2012 gold bull market has seen so little excitement; American and European central banks have leased or swapped their monetary gold into the open market to dampen excitement in the surging gold price. The silence on this scandal in the American financial media is deafening. However, the German financial media, and legislators, are today asking hard questions, and for darn good reasons they want their gold returned from the NY Federal Reserve and the Bank of England.
Let's now look at silver's days of extreme volatility. During the 1970s, silver saw fewer days of extreme volatility than did gold (1970 to 2001). Yes, I placed silver's extreme days threshold at 5.5%, where gold's is only at 3%. But if you compare silver's days of extreme volatility (below) to gold's (one chart up) since 2001, silver's days of extreme volatility have become comparable to gold's since the beginning of our bull market.

There is no surprise why this would be so, if we take President Johnson words below at their face value:
"Now, I will sign this bill to make the first change in our coinage system since the 18th century (the founding of the United States). And to those Members of Congress, who are here on this very historic occasion, I want to assure you that in making this change from the 18th century we have no idea of returning to it. --- If anybody has any idea of hoarding our silver coins, let me say this. Treasury has a lot of silver on hand, * and it can be, and it will be used to keep the price of silver in line with its value in our present silver coin. *
There will be no profit in holding them out of circulation for the value of their silver content." - President LBJ remarks made on signing the Coinage Act on July 23, 1965
Link to Johnson's entire remarks on removing silver from US coinage.
As I recall, the US Treasury held over 5 billion ounces of silver when Johnson removed silver from US coinage in 1965. In 2002 (when days of extreme volatility once again began appearing in silver), the US Treasury announced the exhaustion of this supply, having sold it into the market for less than $10 an ounce. When looking at the above chart plotting silver's days of extreme volatility - keeping this fact in mind.

If you believe the US Treasury (held captive by Wall Street banks for decades) isn't now losing its monetary gold with fraudulent leases and swaps, losing its gold as it did its demonetized silver, in a vain effort to contain inflationary price pressures on metal, you'll be proven wrong.
There is a reason why the US Treasury has refused to submit its gold reserves to a third party audit since Eisenhower was president in the 1950s. We now have a mad-dog inflationist in control of the Federal Reserve, with Germany, and other countries finally asking embarrassing questions about their hundreds or thousands-of-tons of gold held at the New York Fed's bullion vault. This historic fraud days are now numbered. When this becomes public knowledge, we will once again see days of extreme volatility increase in frequency, possibility exceeding the levels seen during the 1970s, as precious metal prices begin their assent to levels that are simply not believable today.
If you don't purchase gold and silver before this scandal becomes known to all, you and your family will suffer the inflationary consequences. I still stand on my prediction for $30,000 gold, and $5000 silver, not so much because of the historical virtues of gold and silver, but from the historical vices of paper money. The same with my prediction for a Dow Jones decline of over 90% because of what these evil people have done to us. They've stolen everything they could sink their meat-hooks into; Social Security, Medicare payroll taxes and now the entire healthcare system, via regulatory confiscation, taxation, or by purchase with soon to be worthless Obama bucks.
There isn't a secure pension fund, public or private in the United States, as Washington's-political class believed they needed your money today, more than you would tomorrow, so they have been confiscating pension assets via monetary inflation for decades. This robbery of pension funds is one of the reasons Uncle Sam now finds it necessary to intervene in the stock and bond markets, to mask their theft. When interest rates once again begin to rise, this robbery will become apparent to all, except maybe for the talking heads on CNBC.
It's no mystery to anyone who has studied American history why the Founding Fathers insisted upon small, limited government and a precious-metal based money supply. They had read their Bibles and remembered passages like this:
"Where is that chief officer? Where is the one who took the revenue? Where is the officer in charge of the towers? You will see those arrogant people no more." - Isaiah 33:18/19 New International Version (NIV) Bible
Possibly the Best Play for a Crash in the
Global Bond Markets
Global Bond Markets
So what is one to do when the law no longer protects you from them, but now protects them from you? This was something MF Global's clients discovered when political and banking insider, Jon Corzine, stole $1.5 billion dollars of his clients' cash, with no fear of legal consequence. Corzine is someone who will never see justice on this side of his grave because Washington and Wall Street are rotten to their cores. The first of two things you should do is to exit those investments that are promoted by Wall Street (stocks, bonds and those ETFs managed by Wall Street), and get as many gold and silver coins as you can afford, while keeping in mind that you still need cash to pay the bills.
Another investment I believe people should seriously consider is taking a small position (2%-5%) in the most hated stock group in North America: Canadian exploration stocks. John Templeton, one of the most successful 20th century investors' secret to success was to buy, in his words, "at the point of maximum pessimism."
Mr. Templeton became famous for telling his broker in 1939 to purchase one hundred shares of every company on the NYSE that was selling for less than $1, in other words, junk investments. His broker reported back that he had done so, except that he had excluded those companies that were in bankruptcy; Templeton wrote back and told him that those were the shares he wanted the most! In six years (1939-1945), the Dow Jones Industrials itself increased only 40%, while Mr. Templeton's portfolio of junk stocks increased 300%. His $10,000 initial investment ultimately increased to $40,000, with 2 of his 104 companies returning $4000 to $1. So this 300% gain during World War 2 was a phenomenal six year return.
My source for this is Dow Jones, so we know that this did happen, and lightning struck again in the early 1960s when Mr. Templeton repeated this performance (if not the 4000/1 gain) when he became one of the first investors to enter the Japanese stock market. Mr. Templeton became a billionaire from investing in Japan, during a time when billionaires were unheard of, and the investors in his mutual fund became wealthy by investing in what other professional money managers refused to even consider.
We are now at the threshold of 2013, with gold and silver entering their thirteenth year of a massive bull market (see my first table above). Exploration companies that traded for over $5 years ago can now be purchased for less than ten cents. In light of the twelve year bull market for gold and silver, this dismal performance is absolute nonsense, so I believe gold and silver exploration shares are now at Mr. Templeton's "point of maximum pessimism", and they are looking pretty good for it.
So why do major mining companies, companies who die a bit with every ton of ore they mine, continue to ignore companies like Eskay Mining? Management in the major mining companies could be stupid, or they have placed their loyalty to Wall Street above their fiduciary obligations to their shareholders, which is more likely. Why would they do that? Because corporate America, and Canada, are team players in a financial system that's on the verge of disintegration.
Look at the long-term US Treasury long-bond yields (Red Plot) in the chart below. The Federal Reserve has promised to continue to monetize trillions of dollars of illiquid debt until the cows come home. If Doctor Bernanke is good to his word, and he will be, this is a commitment by the Federal Reserve to destroy the US dollar as a financial asset. Also, the US Congress hasn't passed a budget bill since 2008, when President Obama became president. Then don't forget that total liabilities for the US Government are now well over $100 trillion, as the US Economy has struggled with over 10% unemployment for the past five years.
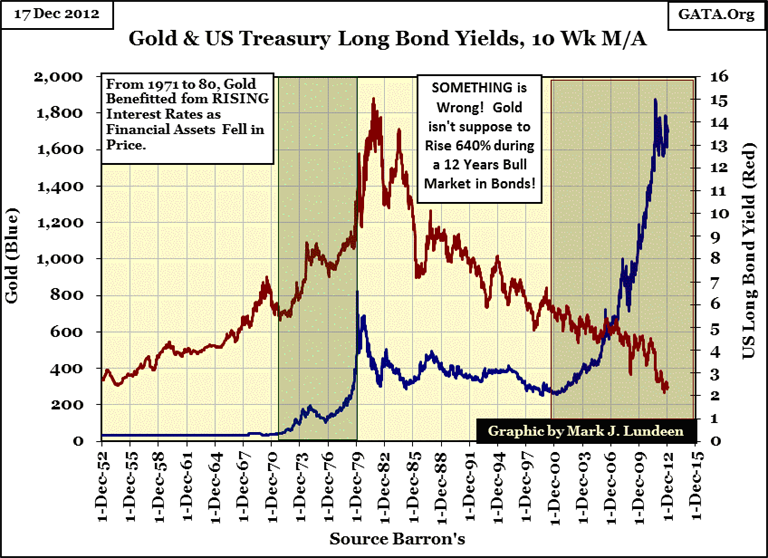
So why in the chart above are Uncle Sam's bonds now yielding only 2.5%, as gold has soared 640% since 2001? Because Washington is manipulating US bond yields, and have attempted, but failed to manipulate the global gold markets downwards. In a sane world, owners of gold would refuse to exchange their metal for US dollars, simply for what Washington is saying and doing to the world's reserve currency it now mismanages.
I anticipate the Canadian exploration industry will see their Templeton moment when US Treasury bond's current yields find themselves somewhere between 4% to 6% in the chart above. This would indicate that oceans of dollars now circulating in the world's stock and bond markets are beginning their historical exiting from paper assets.
More from Gold-Eagle


