Gold Battlefield Technical Update


TLT (T-Bond Proxy ETF) Building A Top Chart
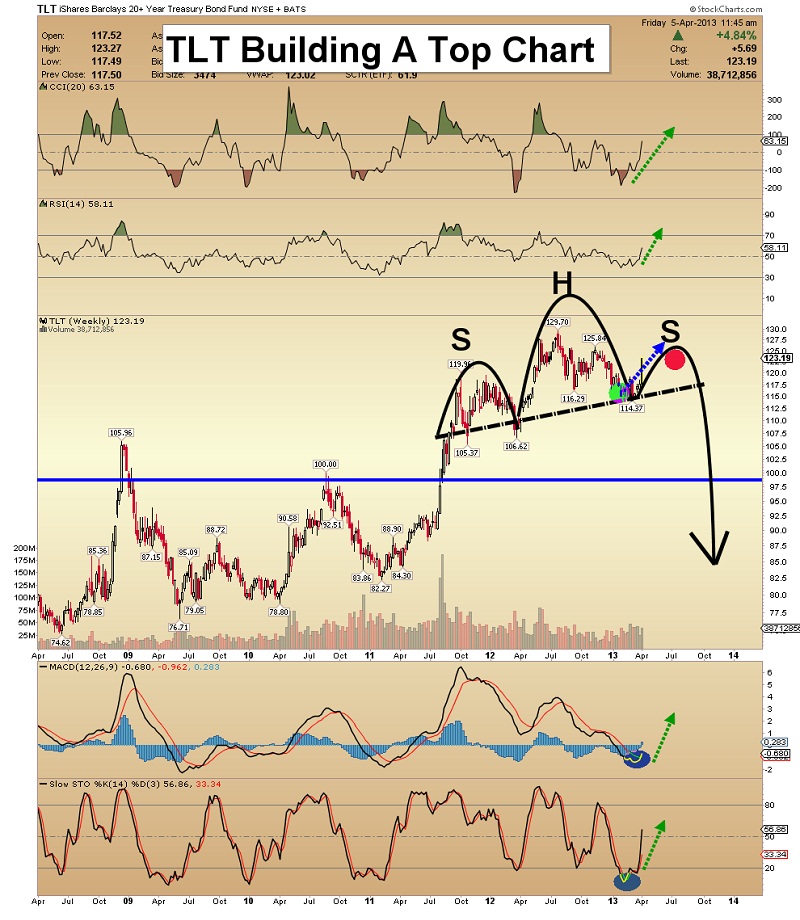
• In the short to intermediate term, the US bond market is in “rally mode”. This move higher should ultimately form the right shoulder of the highlighted h & s top pattern, which is about 6% above the current price area.
• The weekly chart indicators, like MACD and the slow Stokes, are turning up. Sentiment indicators suggest that commercial traders have been heavy buyers recently.
• Stock market insiders may believe that general equities are ready for a hard sell-off. Their buying could be helping the bond market rally. Nimble gamblers could buy the bond now for a quick trade, but for longer term investors, the head & shoulders top pattern is a flashing red light.
Fannie May Housing “Recovery” Chart
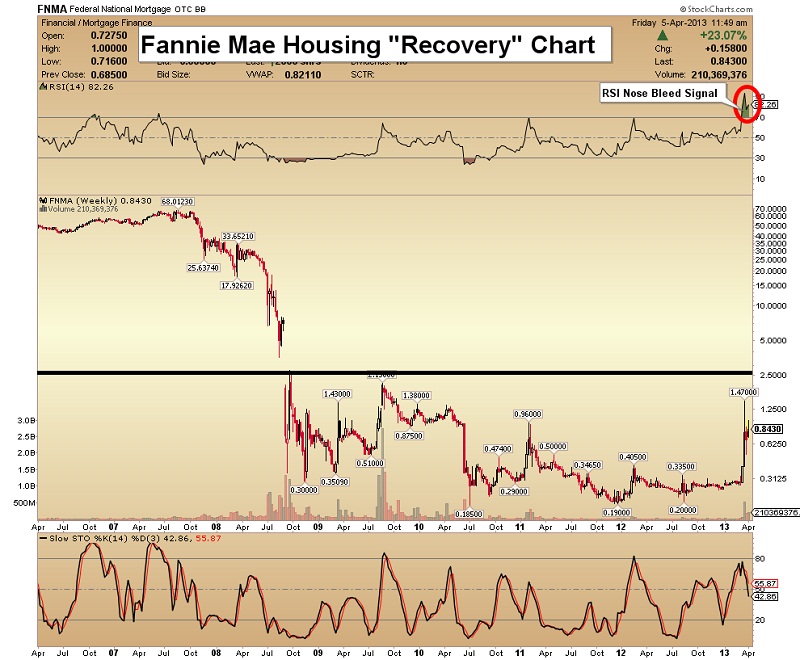
• In 2007, FNMA was trading in the $68 area. Then it collapsed. Over the past few months, mainstream media has touted a “solid recovery” in the housing market.
• The reality is that FNMA is not even back to $1 per share. Unfortunately, the price of FNMA is a key measure of any real recovery in the housing market.
Gold Shakeout Chart
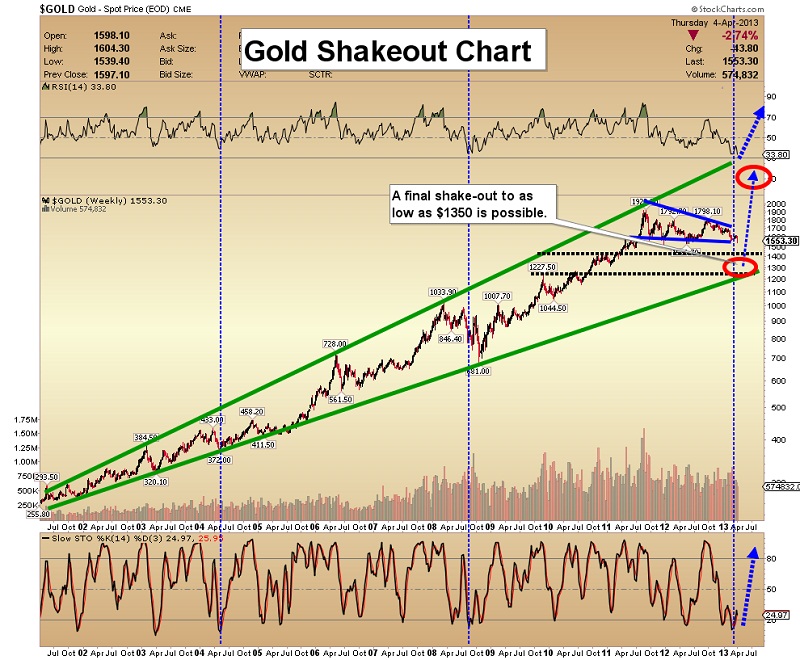
• Ultimately, markets are driven by fear and greed. In the current gold market, there is a lot of fear. Also, most mainstream money managers believe a full economic recovery is underway, so there is no need to own gold.
• My worst-case scenario model shows that gold could fall to $1350, but I don’t see that happening.
• Only a small amount of gold is brought to market each year. Most assets can be substantially diluted in one way or another, but not gold. Physical gold and silver are probably the highest quality assets that an investor can own. Fear of lower prices should not deter anyone from holding gold.
• Note the oversold condition of the slow Stokes indicator and RSI on this weekly chart. There is only one thing for long term investors to do, and that is to hold their positions. Buy more, if additional weakness comes.
Gold Long Tail Cluster Chart
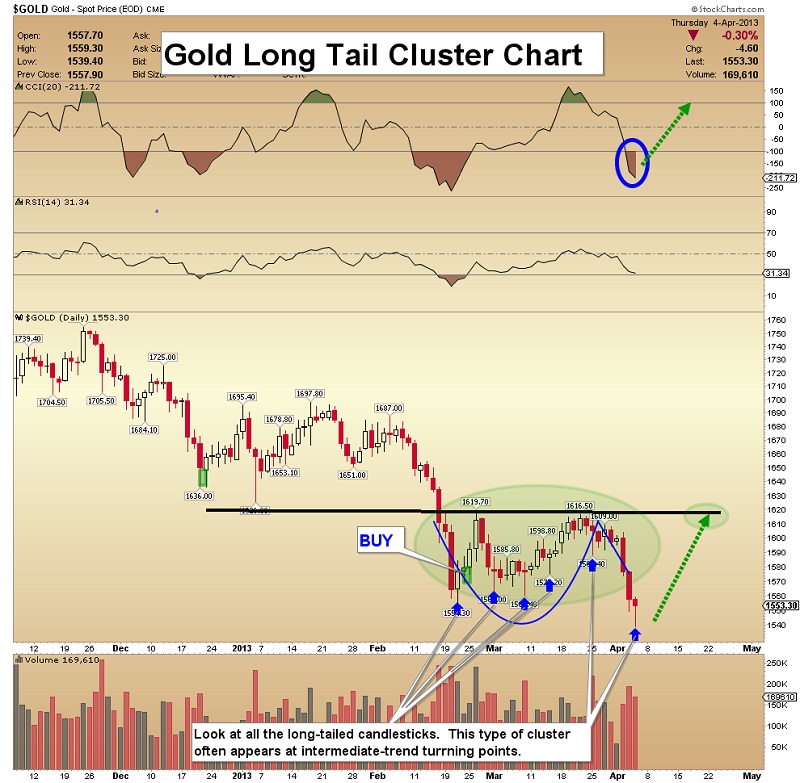
• A cup & handle pattern formed, but it failed. When a h & s pattern or a cup & handle pattern fails, it usually means a “final” reversal is coming soon.
• Note the large number of long-tail candlesticks on this chart. These long-tail clusters often appear when commercial traders are heavy buyers of gold. That’s probably what’s happening now.
HUI (Gold Stocks Index) Stress Test Chart
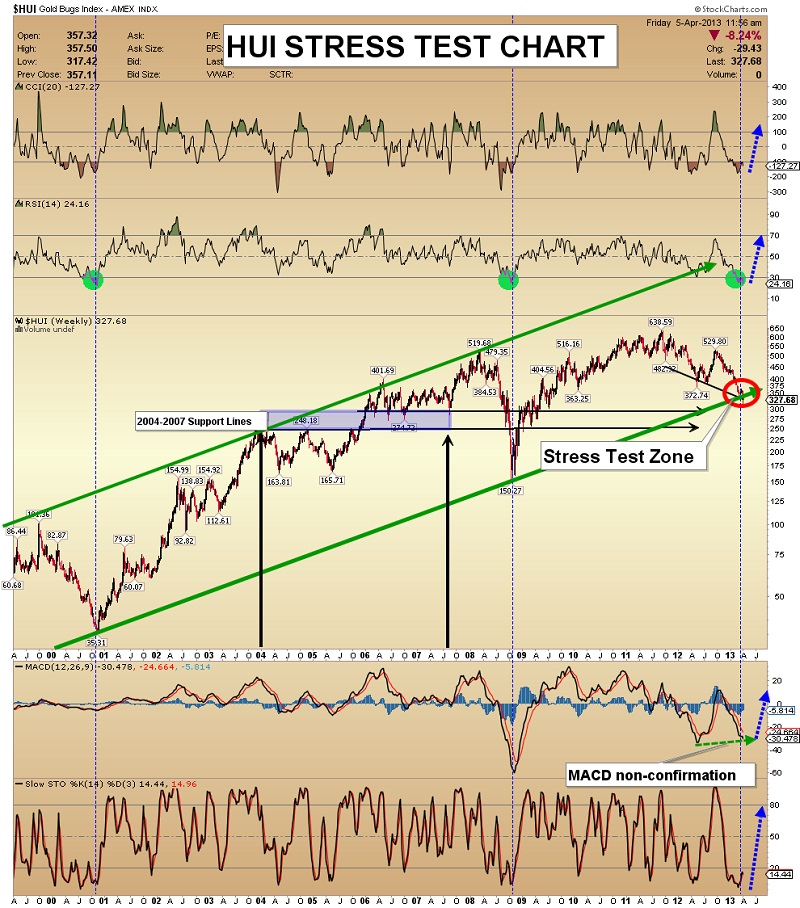
• Gold stocks can be volatile, and have proven to be so, during this bull market. Note the support and resistance levels that I’ve highlighted, going back to 2004.
• The key level to watch on the HUI index, is the 275-300 support zone. This is an area where significant battles between bulls and bears have been waged in the past.
• I didn’t build my concrete manufacturing company, by hiding from risks. The biggest risk for gold stocks that I see is a decline to the 2004 highs. I don’t think it will happen, but I don’t think any gold stock investor should try to hide from the risk of lower prices.
• Note the extremely oversold position CCI, RSI, MACD, and the Stokes. The bears have had their fun in the spotlight, and this weekly chart suggests the jig is nearly up, for them.
GDXJ H&S Bottom Failure Chart
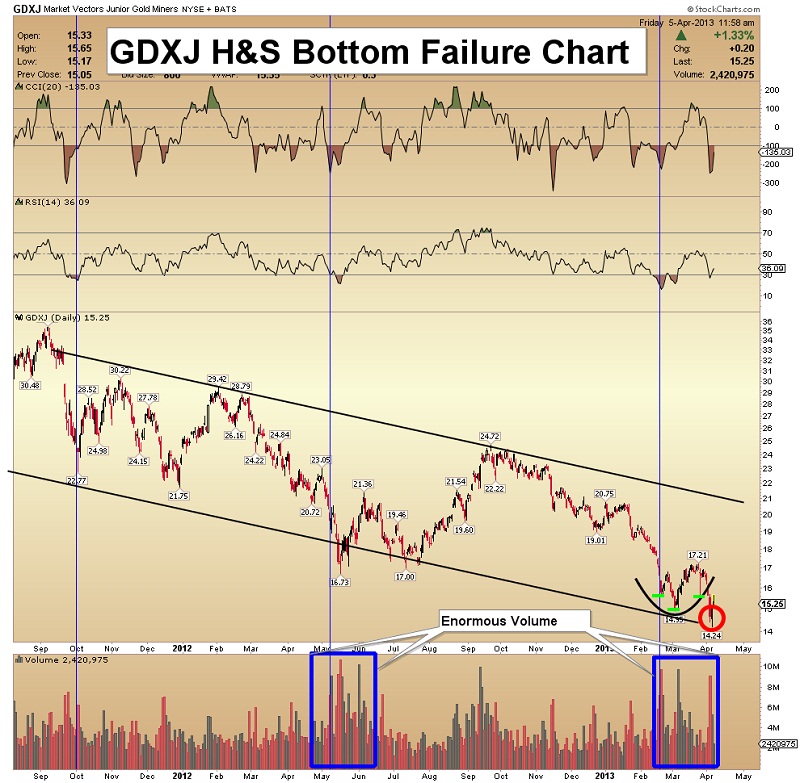
• GDXJ tested the bottom of the down trend channel this week, and the inverse head & shoulders bottom pattern failed. That’s disappointing, but the pattern was pretty small and relatively insignificant.
• Note the volume pattern on this chart, highlighted in blue. It compares favorably to the May-June 2012 period. GDXJ soared about 40% after that burst of trading activity, and I think it could happen again.
Silver Wedge Failure Chart
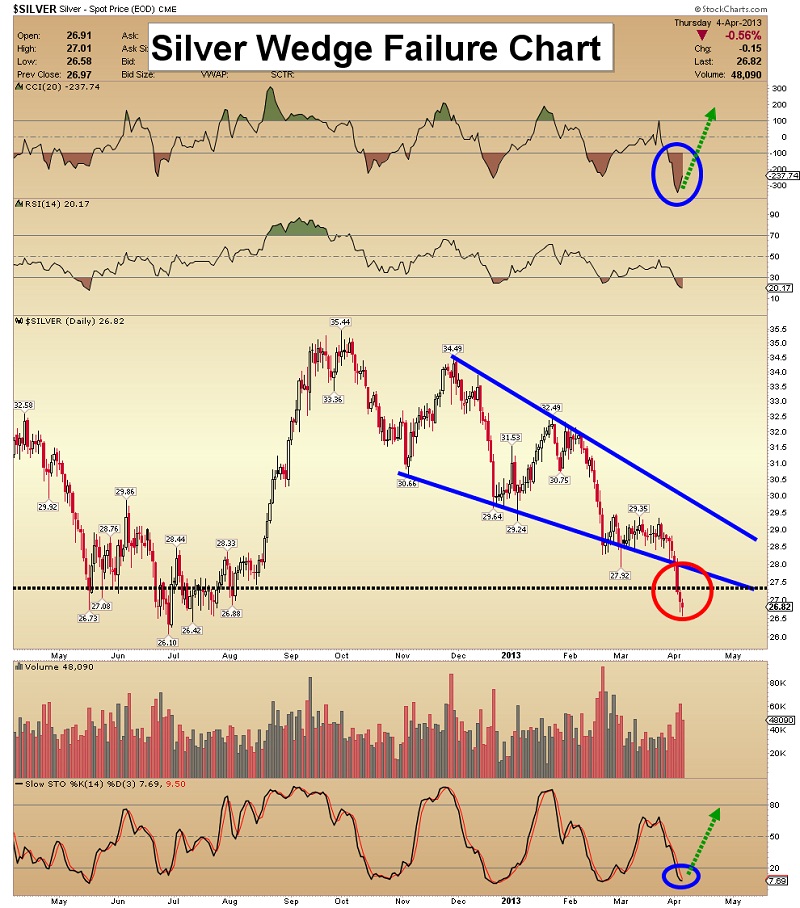
• I mentioned a week ago that more downside action was probably a “necessary evil”, in the short term. A test of the $26 area lows now looks likely, but note the huge spike that has formed on the CCI indicator.
• A lot of amateur investors with shallow pockets have shorted silver recently. Sizeable short-covering rallies often occur soon after this type of CCI spike.
• The other technical indicators on this chart are oversold. I’ve highlighted the bullish wedge pattern failure with a red circle, but I’m not overly-concerned by it. I think the CCI spike is the dominant technical indicator right now, and it is bullish.
Silver Public Opinion Chart
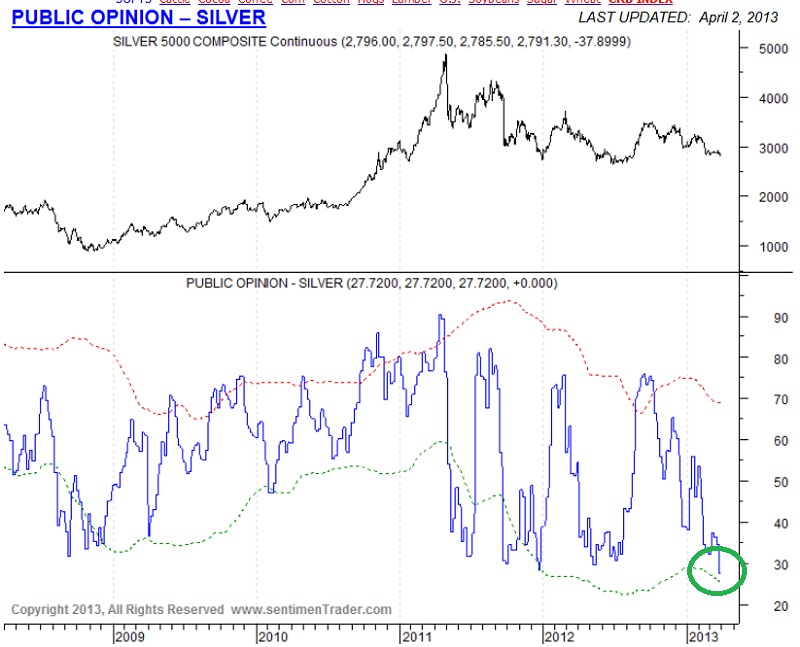
• The latest data from sentimentrader.com shows that the public is quite pessimistic about silver. In the past, such pessimism has occurred near important bottom areas!
Unique Introduction For Gold-Eagle Readers: Send me an email to [email protected] and I'll send you 3 of my next Super Force Surge Signals, as I send them to paid subscribers, to you for free. Thank-you!
Stay alert for our Super Force alerts, sent by email to subscribers, for both the daily charts on Super Force Signals atwww.superforcesignals.com and for the 60 minute charts at www.superforce60.com
About Super Force Signals:
Our Super Force signals are created thru our proprietary blend of the highest quality technical analysis and many years of successful business building. We are two business owners with excellent synergy. We understand risk and reward. Our subscribers are generally successful business owners, people like yourself with speculative funds, looking for serious management of your risk and reward in the market.
Frank Johnson: Executive Editor, Macro Risk Manager.
Morris Hubbartt: Chief Market Analyst, Trading Risk Specialist.
Super Force Signals
422 Richards Street
Vancouver, BC V6B 2Z4
Canada


