Is Gold On The Brink Of A Breakout?


After a surprisingly strong and especially fast rally from an oversold bottom in mid-December at 1,236 USD up to 1,365 USD within less than seven weeks - and the recent pullback down to 1,305 USD, gold has been rushing back up towards 1,360 USD over the last couple of days. While enthusiasm among the goldbugs has certainly increased, the question remains whether it is really justified - and whether gold indeed will be able to break out.
1. Gold Weekly Chart
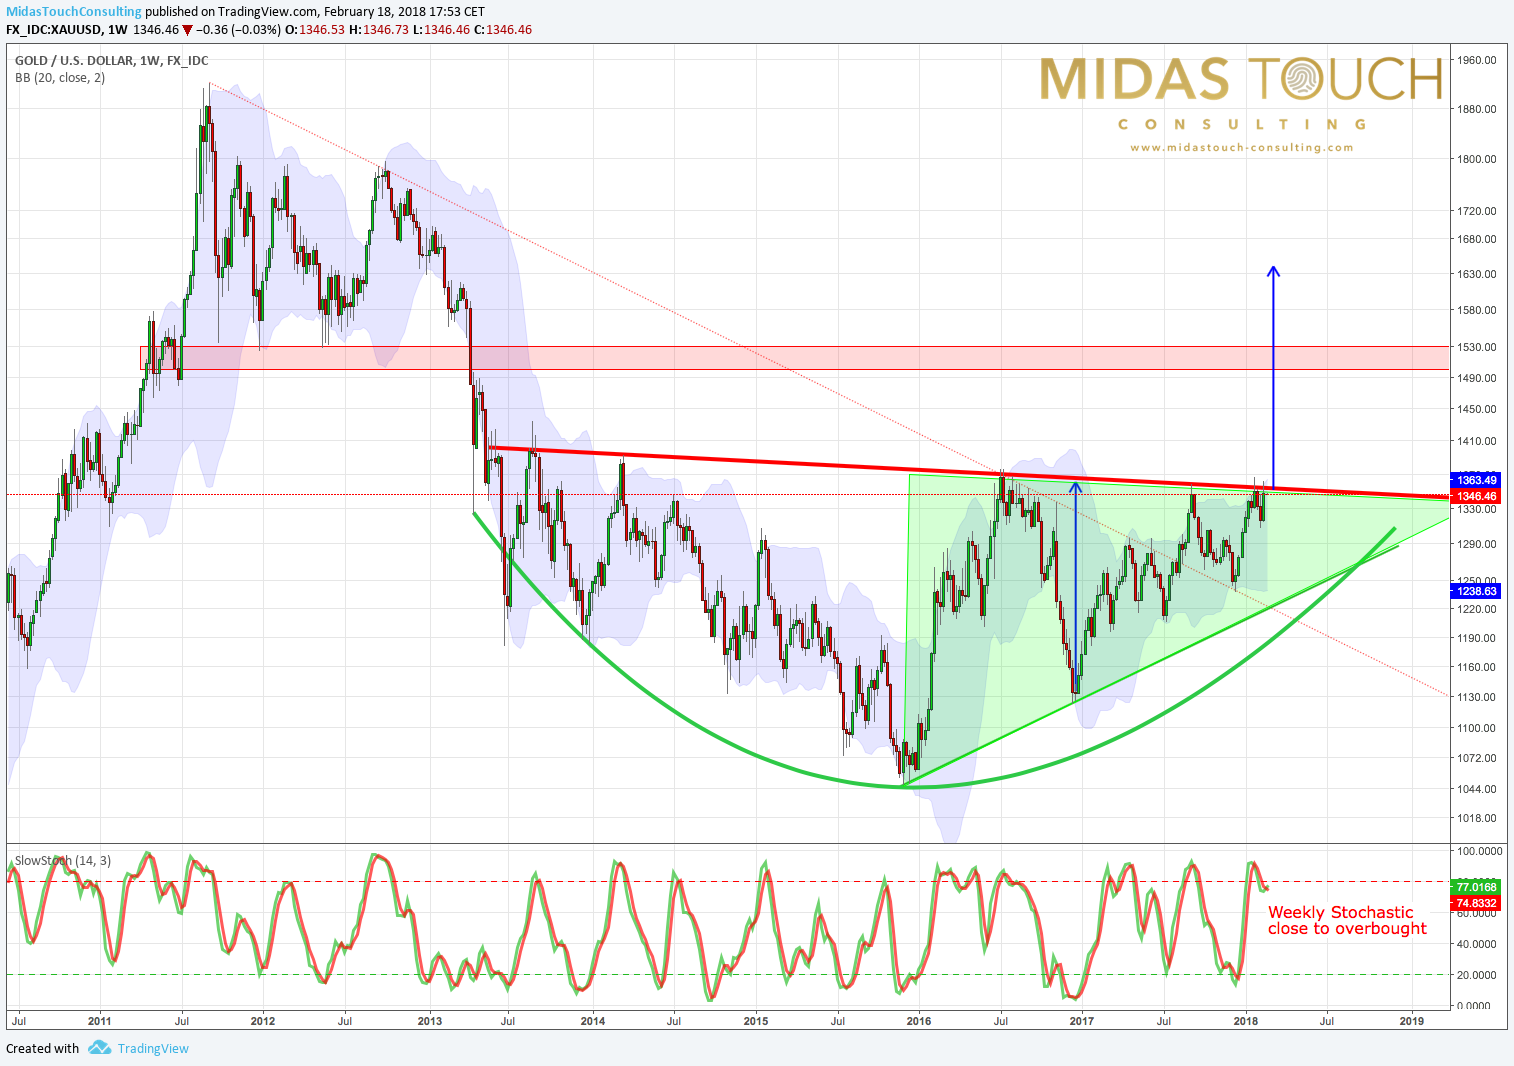
Looking at the weekly chart gold has reached the important resistance line again and is trying to break out. If we assume that the last four and a half years have been some kind of a bottoming process and that gold has been moving within an ascending triangle over the last two years a breakout above 1,360 USD on a weekly basis would certainly be a pretty bullish signal. In that case using the height of the triangle would give us a theoretical target around 1,630 - 1,650 USD. Of course on the way to this distant number gold needs to clear the massive resistance zone around 1,500 - 1,530 USD first which won't be easy at all!
Unfortunately on the weekly chart we find the slow stochastic oscillator close to its overbought zone which definitely raises doubts whether gold indeed is ready to break out now. Actually just judging on this oscillator gold would probably need more consolidation between 1,280 and 1,350 until early summer before the bulls have enough power to boost sustainably through this longterm resistance.
As well the ascending triangle might simply demand some more consolidation as the formation doesn't really look in its final stage. Gold could easily swing between 1,250 USD and 1,350 USD without disturbing the improving picture.
Another resistance comes in form of the weekly Bollinger Band which currently sits at 1,363 USD. Generally 95% of the time prices are moving within these two bands. Therefore gold would really need to deliver a feat here to push the Bollinger Band higher. With the weekly chart being close to overbought this might be challenging.
But it is very obvious that gold is at an important juncture and that bulls are gaining more and more control. If gold can break through the multi-year resistance line we could quickly see a rally towards 1,500 USD despite any seasonal patterns.
2. Gold Daily Chart

The daily chart zooms into the last two years in the gold-market. While failing at the horizontal resistance zone between 1,350 USD and 1,375 USD again and again we can clearly see a series of higher lows which is pretty constructive. Gold is moving above its 200MA (1,284 USD) as well as above its 50MA (1,314 USD) which was slightly missed during the recent pullback. The chart is looking more and more bullish.
But here too the slow stochastic is overbought and does not offer much more room on the upside. If you´re familiar with my analysis you know that there is sometimes this special situation where the slow stochastic oscillator can transform into an embedded status and lock in the uptrend while being overbought. This situation is not normal but rare and is still at least four trading days away on the daily chart. Usually the stochastic will simply roll over in such an overbought situation.
Gold has good support around 1,305 USD - 1,310 USD and very strong support between 1,260 USD and 1,280 USD.
If gold can hold above 1,245 USD for some more days, odds definitely support a breakout and a continuation of the rally. If gold instead moves back below 1,335, then the USD the bull attack will have failed - and corrective wave down will become very likely. Actually if gold can not take out the January highs at 1,365 USD, the current up wave might just be a minor B...and gold would be right in front of lower prices...
3. Conclusion
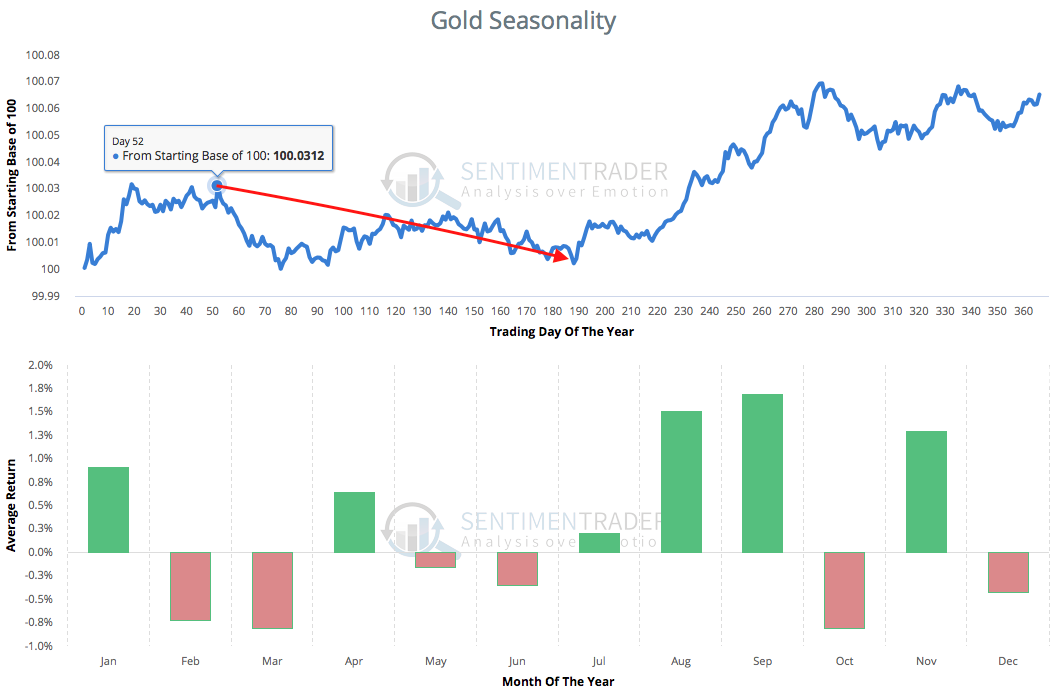
Gold is acting pretty bullish...but is getting overbought on its daily and weekly chart. As well we have to remind ourselves that the weak seasonal cycle typically starts end of February and usually lasts until June. As the Chinese Year Of The Dog celebration started last Friday one of the most important physical buyers will be absent over the next couple of weeks. We often have witnessed sharp pullbacks during this timeframe of the year.
As well another factor that doesn't really fit into an immediate bullish picture is the extremely overbought situation in the US-Dollar. Technically the Euro might have a few more cents towards 1,26 - 1,27 USD to run but the CoT-reports sending massive warning signals as the professional money is betting clearly on a recovery in the US-Dollar. Should the US-Dollar start indeed a countertrend bounce gold and the precious metals sector certainly will suffer.
Another questionable signal is the lagging silver price. With a gold/silver-ratio around 80, silver is without a doubt undervalued and a good longterm physical buy. But from a technical point of view the weak gold/silver-ratio is not bullish for the sector at this moment.
On top the mining stocks have been severely lagging gold´s strong performance. They might be working on a similar bear trap like in January 2016 and mining stocks in general just desperately need confirmation from a higher gold price but right now they don't bring any bullish arguments to the table....
I guess the next week will already bring clarity. If gold can maintain its recent strength, we might get a run towards 1,375 USD...maybe even 1,400 USD. This of course will create a little buying panic among amateur investors, which is the perfect setup for the banks to create the top and turn the gold market back down.
To the contray I believe it is more likely we will see the gold-market rolling over next week as there won't be any physical demand from China...moreover, Friday´s reversal already is sending some technical warning signals.
Overall of course we always have to listen to the market! Therefore, I will immediately change my slightly bearish view if the breakout indeed gets confirmed with a weekly close above 1,365 USD! Otherwise, I expect gold to run through another corrective cycle in the next few months - and shall therefore patiently wait for the next buying opportunity once its oversold again.
*********
If you like to get regular updates on our gold model, gold and bitcoin you can subscribe to my free newsletter here: http://bit.ly/1EUdt2K
© Florian Grummes 2017 all rights reserved
Hohenzollerstrasse 36, 80802 Munich, Germany
Disclaimer & Limitation of Liability
The above represents the opinion and analysis of Mr Florian Grummes, based on data available to him, at the time of writing. Mr. Grummes's opinions are his own and are not a recommendation or an offer to buy or sell securities. Mr. Grummes is an independent analyst who receives no compensation of any kind from any groups, individuals or corporations mentioned in the Midas Touch. As trading and investing in any financial markets may involve serious risk of loss, Mr. Grummes recommends that you consult with a qualified investment advisor, one licensed by appropriate regulatory agencies in your legal jurisdiction and do your own due diligence and research when making any kind of a transaction with financial ramifications. Although a qualified and experienced stock market analyst, Florian Grummes is not a Registered Securities Advisor. Therefore Mr. Grummes's opinions on the market and stocks can only be construed as a solicitation to buy and sell securities when they are subject to the prior approval and endorsement of a Registered Securities Advisor operating in accordance with the appropriate regulations in your area of jurisdiction. The passing on and reproduction of this report is only legal with a written permission of the author. This report is free of charge. You can sign up here: http://eepurl.com/pOKDb
Hinweis gemäß § 34 WpHG (Deutschland):
Mitarbeiter und Redakteure des Midas Touch Gold Newsletter halten folgende in dieser Ausgabe besprochenen Wertpapiere: physisches Gold und Silber, Bitcoins sowie Gold-Terminkontrakte.
Imprint & Legal Disclosure
Anbieterkennzeichnung gemäß § 6 Teledienstgesetz (TDG)/Impressum bzw. Informationen gem § 5 ECG, §14UGB, §24Mediengesetz
Herausgeber und verantwortlich im Sinne des Presserechts / inhaltlich Verantwortlicher gemäß §6 MDStV
Florian Grummes
Hohenzollernstrasse 36
80801 München
Germany
E-Mail: [email protected]
Website: www.midastouch-consulting.com
 Florian Grummes (born 1975 in Munich) has been studying and trading the Gold market since 2003. In 2008 he started publishing a bi-weekly extensive gold analysis containing technical chart analysis as well as fundamental and sentiment analysis. Parallel to his trading business he is also a very creative & successful composer, songwriter and music producer. You can reach Florian at: [email protected].


