Gold Bullion Demand Surges 27% In Q3 – New Chinese “Buying Spree”
 share
share
 share
share
 share
share
 share
share
 share
share
 Gold Demand Trends Q3 2015 was released by the World Gold Council today. The quarterly publication is the leading industry resource for data and opinion on global gold demand and examines demand trends by sector as well as geography.
The key findings from the report are as follows:
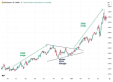
[Graphic source: World Gold Council]
- Overall demand increased by 8% year-on-year to 1,121t as selling of futures contracts and ETFs contributed to a price dip, 6% in July, which buoyed gold demand around the world.
- Total consumer demand – made up of jewellery demand – totalled 928t, up 14%.
- Global investment demand saw a significant rise of 27% to 230t, up from 181t in Q3 2014.
This was led by the US which saw a surge in bar and coin demand – it tripled and was up 207% to 33t from 11t on the same period last year, with massive demand from China, up 70% to 52t and Europe up 35% to 61t.
China’s sharp devaluation of the yuan this summer sparked another gold bar and coin “buying spree” in China according to the World Gold Council, as canny store of wealth buyers sought to shelter themselves from further market volatility and sharp falls in stock markets.
Much of this European demand came from Germany and Austria where demand remains very high due to heightened German concerns about the euro, the European and global economy.
- Global jewellery demand for Q3 2015 was up 6% year-on-year to 632t compared to 594t in Q3 2014. In India, demand was up 15% to 211t and China was up 4% to 188t. The US and the Middle East also saw gains, up 2% to 26t and 8% to 56t respectively.
- Central bank demand reached 175t, the 19th consecutive quarter of net purchases. Russia continued to “lead the pack” in terms of central bank purchases.
- Demand in the technology sector declined 4% to 84t as the sector continued to endure pressure, with the industry choosing to shift towards alternative, cheaper materials in technological applications.
- Total supply was 1,100t in Q3, up 1% year-on-year. Total mine supply (mine production + net producer hedging) remained relatively flat up 3% year-on-year to 848t compared to 814t in the same period last year. Year-on-year quarterly mine production shrank by 1% to 828t in Q3 2015 against 836t in Q3 2014. Recycling
********
Courtesy of www.GoldCore.com
share
share
share
share
share
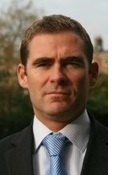 Mark O'Byrne is executive and research director of www.GoldCore.com which he founded in 2003. GoldCore have become one of the leading gold brokers in the world and have over 4,000 clients in over 40 countries and with over $200 million in assets under management and storage.We offer mass affluent, HNW, UHNW and institutional investors including family offices, gold, silver, platinum and palladium bullion in London, Zurich, Singapore, Hong Kong, Dubai and Perth.