Gold Chart Easter Eggs


TLT (T-Bond Proxy ETF) Tradable Rally Chart
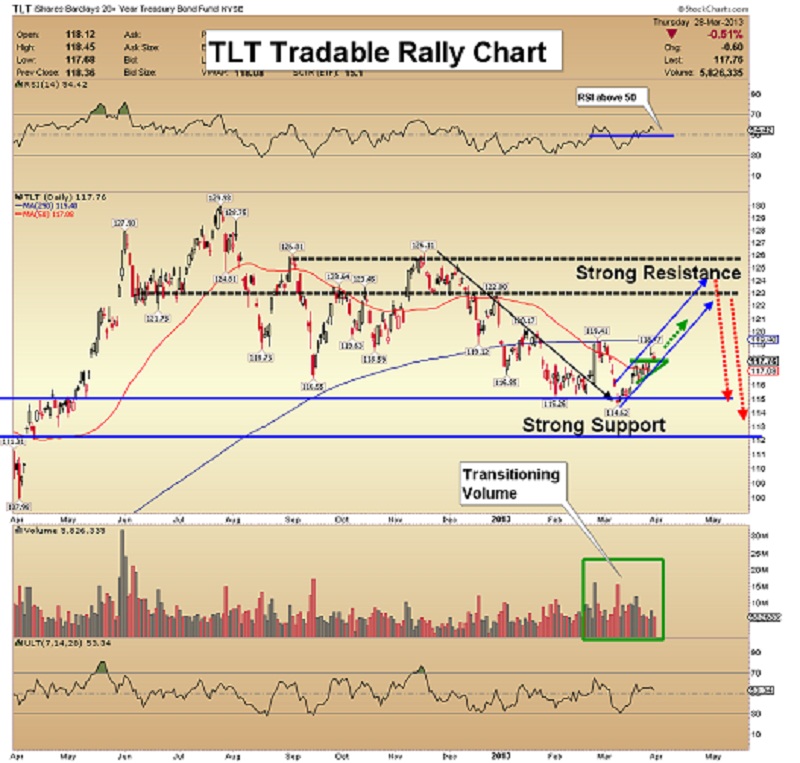
• I’m not a bond market bull, and when the bond market was trading near the recent highs, I shorted it.
• There is a nice opportunity for investors to buy the bond now, but just for an intermediate-term trade.
• In recent weeks, volume patterns have been transitioning from bearish to bullish, which I’ve highlighted on this chart. The bond has moved down into the area that I’ve identified as support. A small rally is now underway.
• This week, my proprietary technical indicators moved into in an even more bullish posture. At the same time, they are turning very negative for the broad stock market.
Gold Big Picture Chart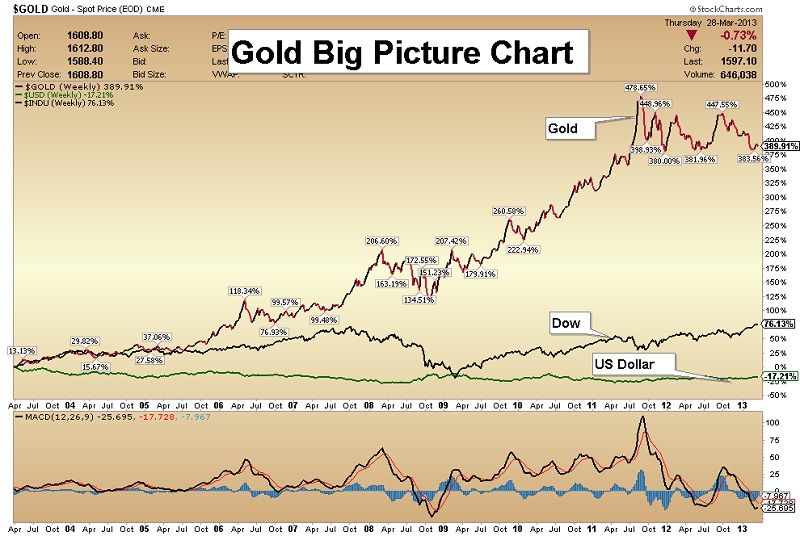
• Let’s put the dollar, the Dow, and gold together, and let the winning bull market “stand up” and present itself.
• You can see how dramatically old has outperformed the Dow, for many years. The dollar shows no performance at all.
Gold COT Support Chart
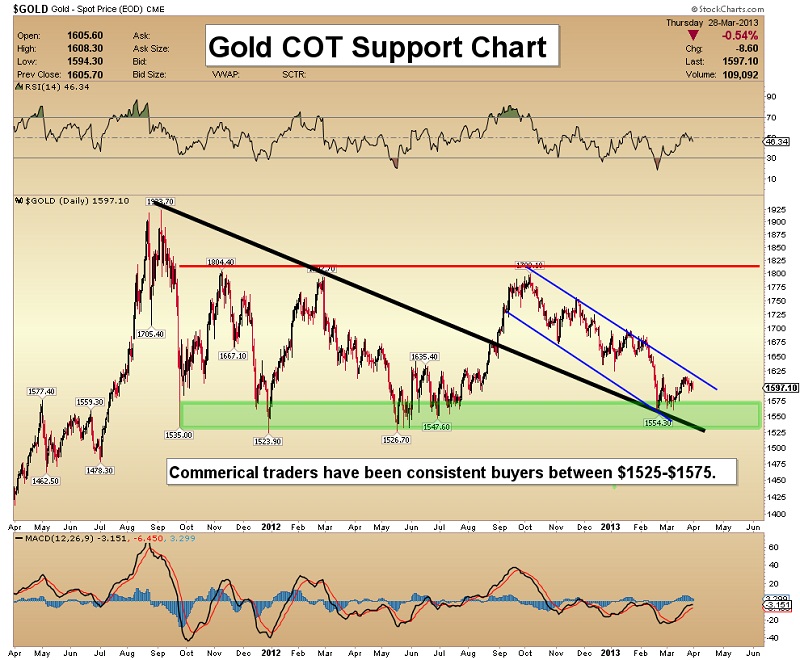
• One of the key characteristics that I monitor in the gold market is the action of commercial traders.
• Each time that the gold price has fallen to the $1575 area, they have bought gold very aggressively.
• Their buying is not a guarantee that gold will rally immediately. It is an indication that they see value in the market in that general price area.
Gold Stocks (GDX) Versus Gold Chart
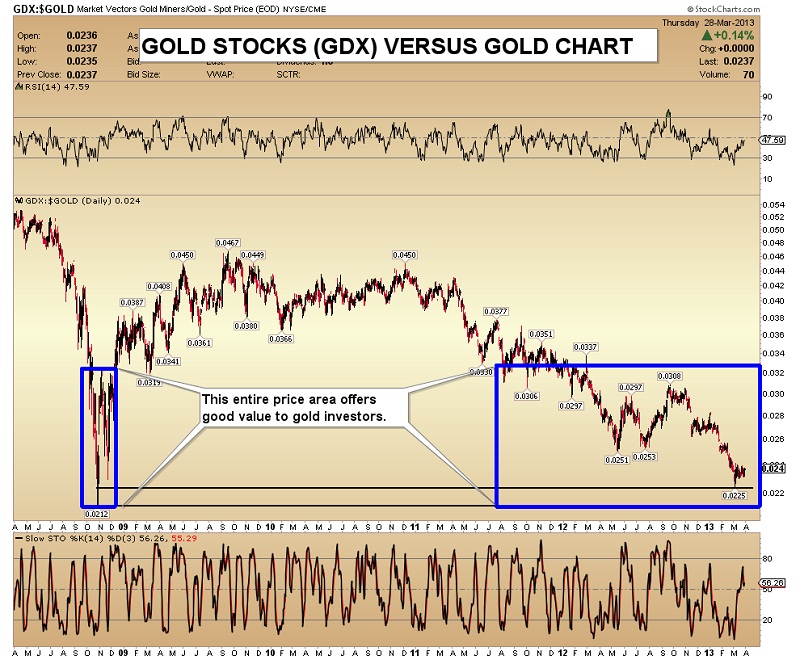
• GDX, and most gold stocks, are now nearly as cheap as at the lows of 2008 when compared to the price of Gold.
• The case for higher gold prices has never been stronger than it is right now. If gold does achieve new all-time highs, gold stock analysts will probably have to change their ratings on the gold miners. That’s great news, for gold stock enthusiasts!
Gold Miners BPI Chart

• The bullish percent index chart has produced the crossover buy signal that I have been looking for, with the 10 day moving average crossing the index.
• The Coppock indicator has crossed the zero line.
• Note the head & shoulders pattern on GDX, and the nice buy signal on the TRIX indicator, at the bottom of the chart.
• The weight of the evidence is slowly shifting into the bulls’ corner.
GDXJ Channel Targets Chart
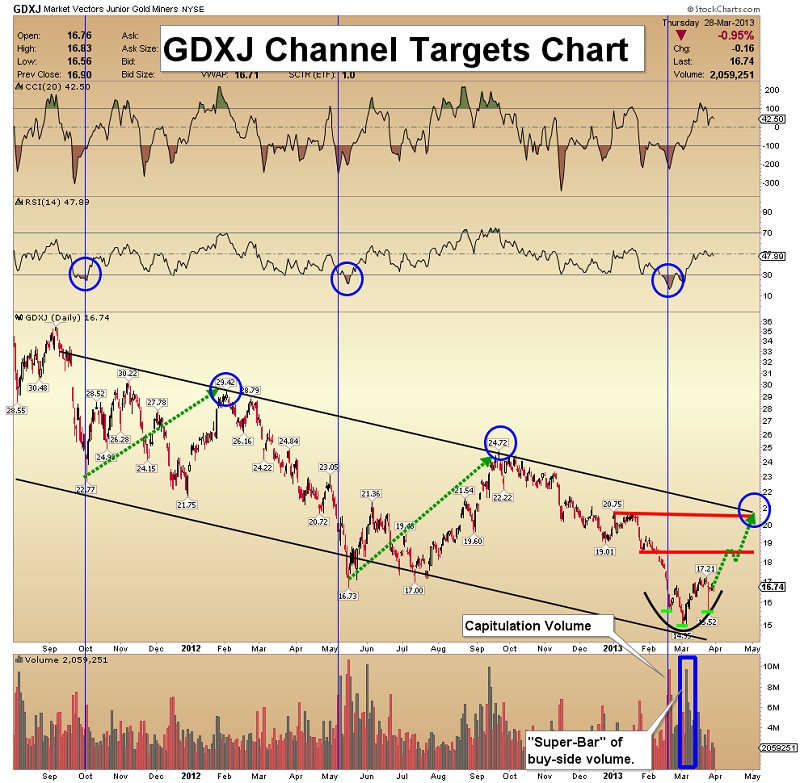
• The GDXJ chart looks very good. There’s a nice head & shoulders bottom in play, and volume is excellent.
• I think the rally will stall in the $18.50-$19 area, and then re-assert itself, with GDXJ ultimately reaching about $21.
• From there, I expect a substantial battle between the bulls & bears. Obviously, I’m cheering for the bulls, and the tecnicals suggest they will win that battle.
• In terms of positioning, I’m long GDXJ, and carrying a light position in DUST-nyse as a hedge.
Silver “Not Quite There” Chart

• The Bollinger bands mentioned here last week continue to tighten. This doesn’t mean a big upside move is imminent, unfortunately. It means the verdict is still out, as to whether the next trending move will up or down.
• At this point, I see limited downside for silver, with a floor in the $27 area. Commercials traders have seemingly grown more bullish on silver than gold recently.
• I’m a little concerned by the latest test of the lower Bollinger band, but not in terms of the big picture. I call this the “Not Quite There” chart, because there could be one last dip down, before silver makes the bulls very happy, indeed!
Unique Introduction For Gold-Eagle Readers: Send me an email to [email protected] and I'll send you 3 of my next Super Force Surge Signals, as I send them to paid subscribers, to you for free. Thank-you!
Stay alert for our Super Force alerts, sent by email to subscribers, for both the daily charts on Super Force Signals atwww.superforcesignals.com and for the 60 minute charts at www.superforce60.com
About Super Force Signals:
Our Super Force signals are created thru our proprietary blend of the highest quality technical analysis and many years of successful business building. We are two business owners with excellent synergy. We understand risk and reward. Our subscribers are generally successful business owners, people like yourself with speculative funds, looking for serious management of your risk and reward in the market.
Frank Johnson: Executive Editor, Macro Risk Manager.
Morris Hubbartt: Chief Market Analyst, Trading Risk Specialist.
Super Force Signals
422 Richards Street
Vancouver, BC V6B 2Z4
Canada


