Gold Commitments Of Traders Report: Speculators Are In A world Of Hurt


Methinks the continued persistence of the entire speculative crowd (Hedge Funds, Large Reportables and the General Public) in remaining on the long side of the gold market must be due to excessive exposure to the plethora of gold perma-bull websites. There really is no way to explain this in my view as the charts are quite clear and have been for some time now.
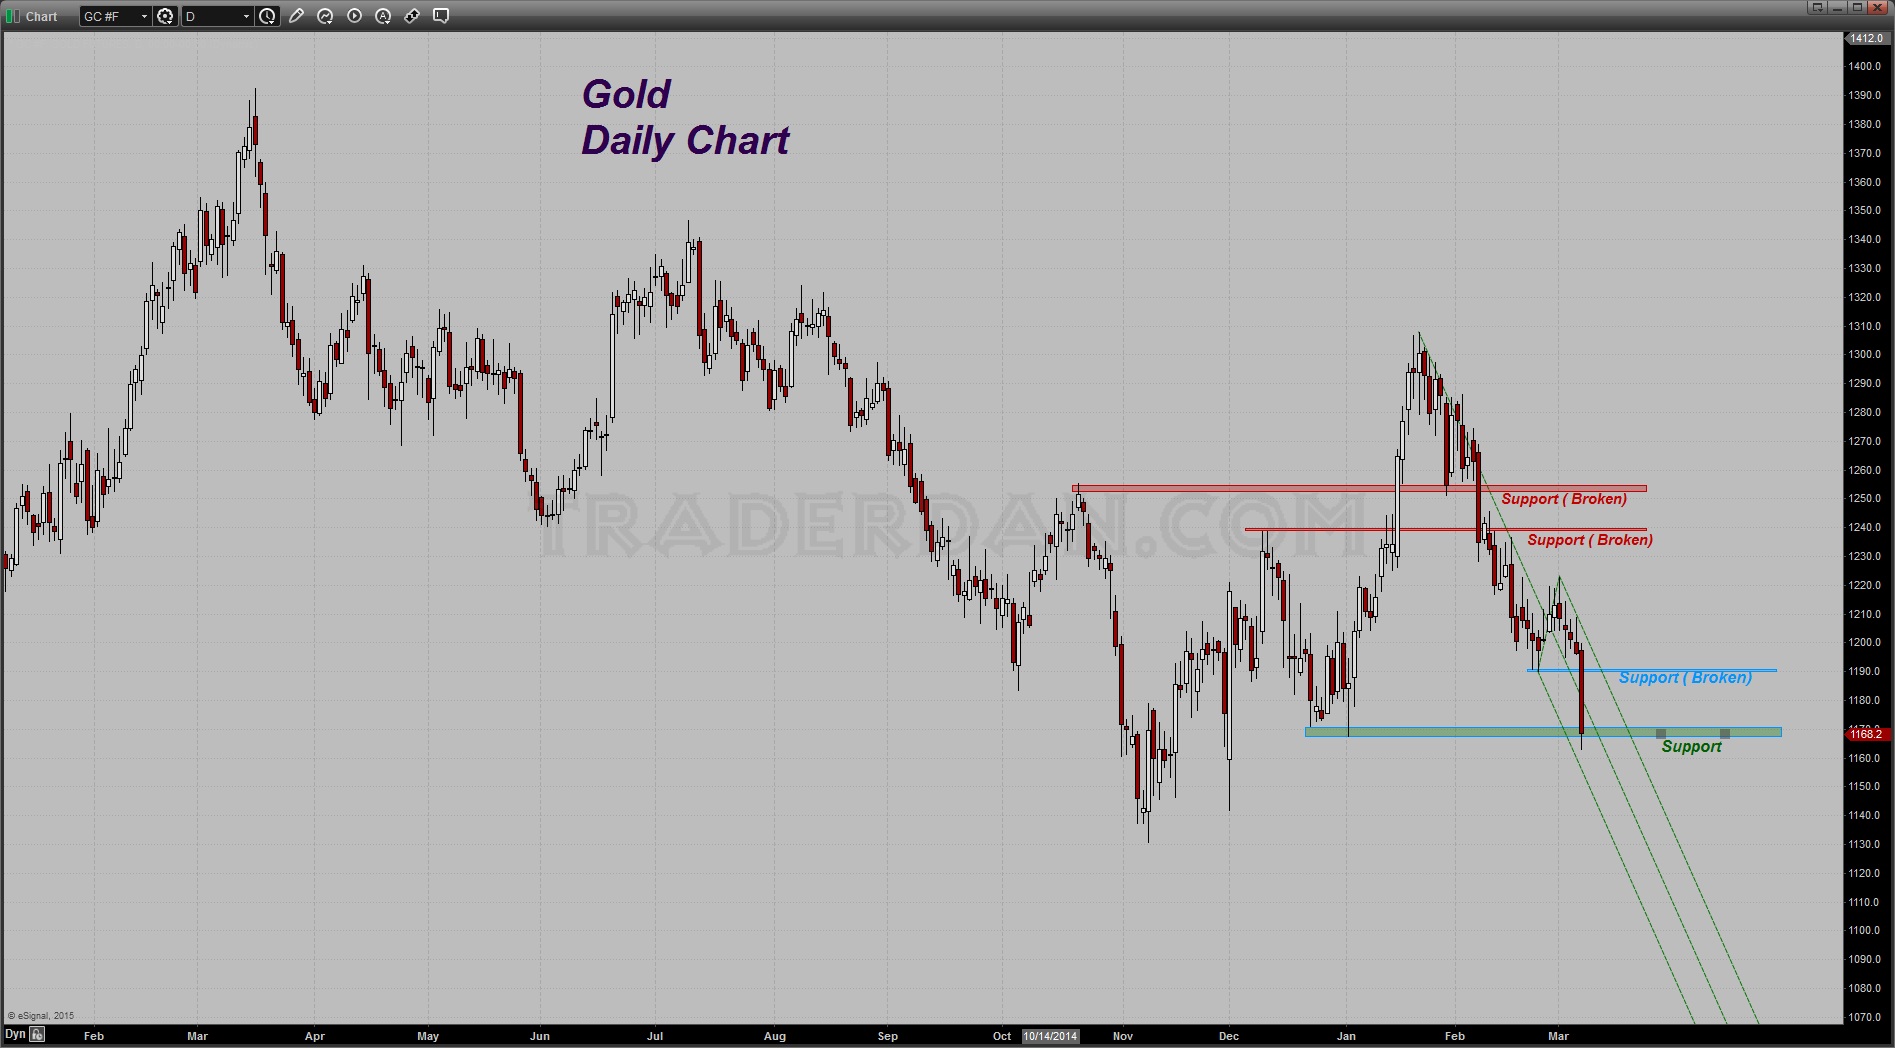
Here is the Daily Chart: Three support levels have given way as if they did not even exist. Gold did bounce off of the support level shown near $1170-$1165 but the bounce looks feeble and more of a “let’s book some profits before the weekend” kind of pop rather than any sign of strong, concerted buying.
Let me take a moment here to express my utter disdain at the charlatans in the gold cult who are once again out making more excuses for their pathetic predictions of soaring gold prices, etc., By now you know the usual drill – make fearless (and idiotic) predictions of “this is it”; “gold to soar”; “Chinese and Indian buying to take gold to new highs”, blah, blah and more blah. When gold drops lower and their useless predictions are found to be vapid, they trot out the usual “this is official sector selling of the gold market to suppress the price”, drivel.
Let’s be honest here – these quacks no more know what gold is going to do next than my dog does. Yet for some bizarre reason, which I still am unable to comprehend, in spite of a treasure trove of failed predictions, the naïve gold cult devotees still put these people on some sort of pedestal and dote upon every phrase and sentence coming out of their mouths as if they are the modern version of the Oracle at Delphi.
Reader – if you are one of their victims, WAKE UP. The charts will tell you what you need to know and right now, the charts, as they have been doing for some time now, say, the price is headed lower.
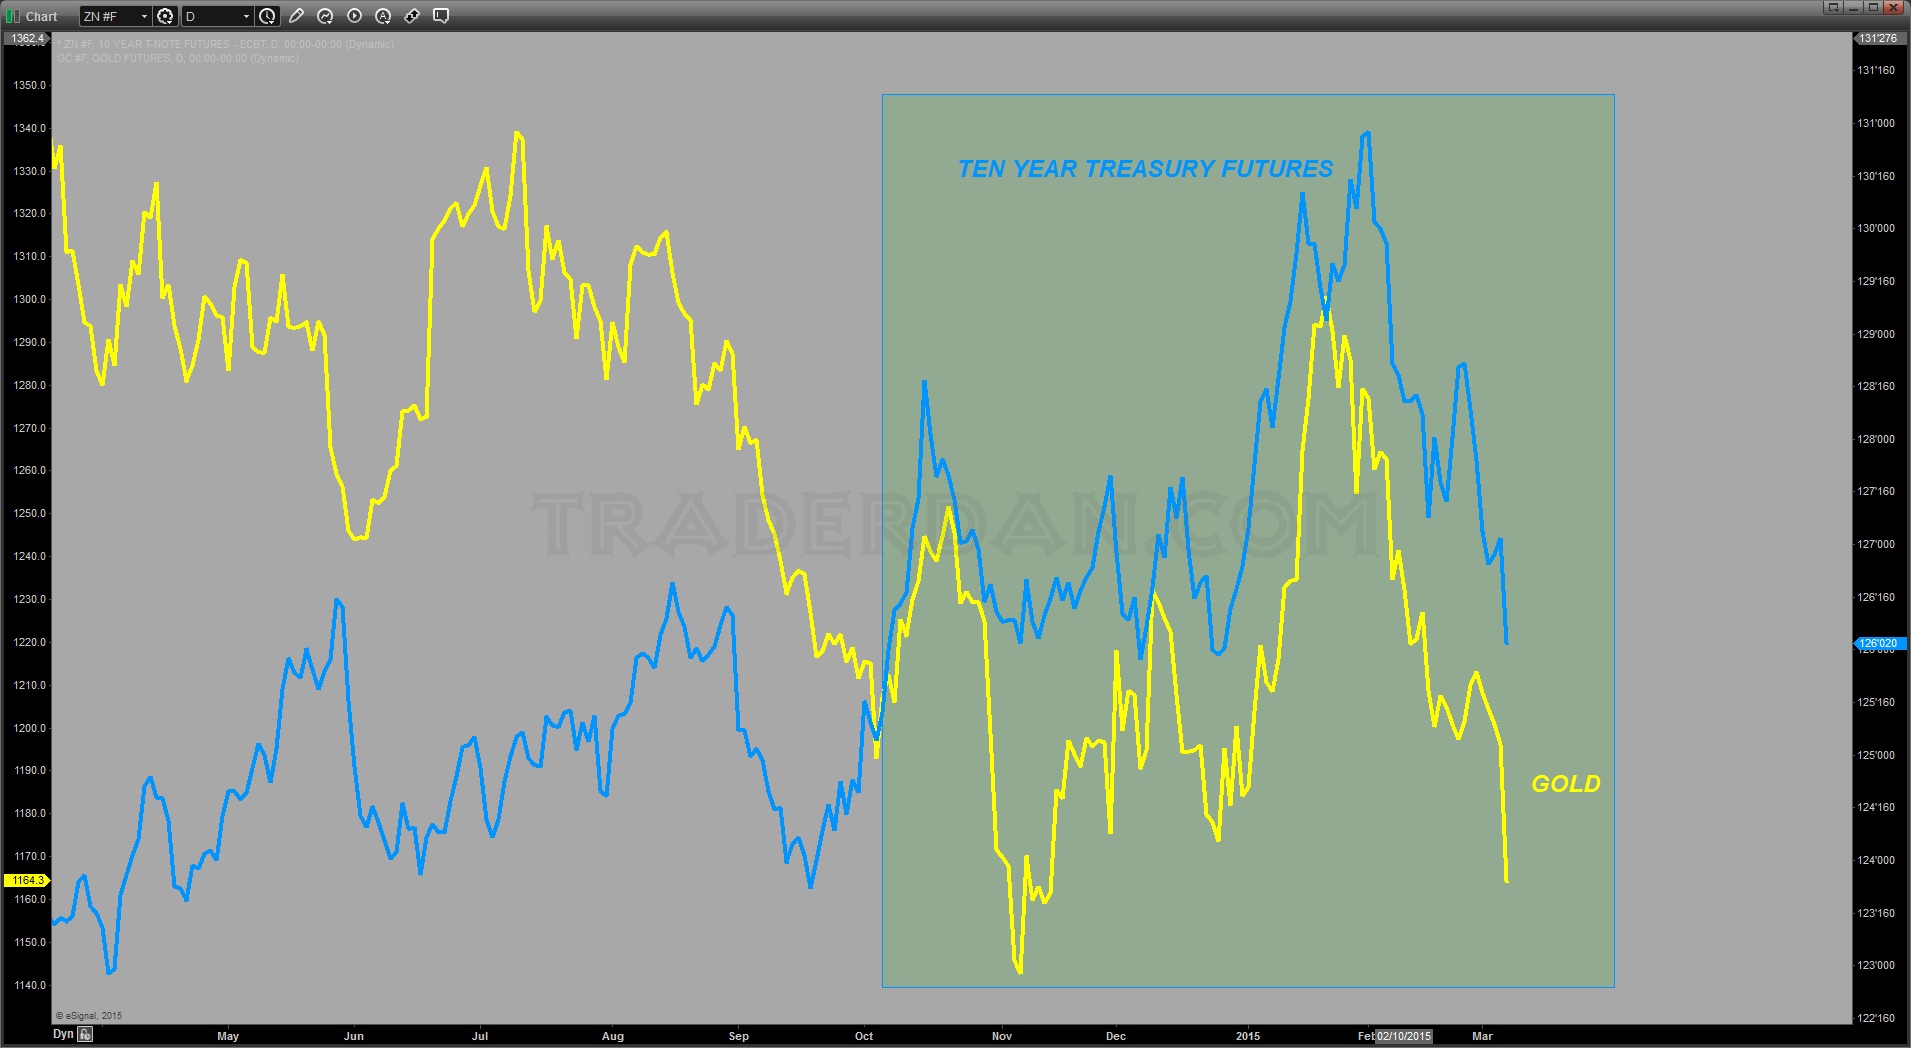
I have noted the relationship that has developed between gold and the Ten Year Treasury futures contract since October of last year. Both markets are moving in sync. As the Ten Year futures moves lower, (interest rates rise), gold sinks. It is really that simple. No manipulation BS, no “official sector selling”, No, “evil bullion banks slamming gold”, No, “gold cartel takedown”, ad nauseaum, ad infinitum.
Gold is simply another asset class that competes for precious investment capital allocation by investors. It pays no yield, throws off no dividend nor earns interest of any sort and therefore MUST HAVE FEAR, and lots of it, to produce any gains for its holder. With investor confidence growing in regards to the overall global economy, gold is seeing both liquidation from disaffected longs as well as short selling by those who believe it is going to lose even more fans throughout the remainder of the year. There is nothing the least bit sinister about this.
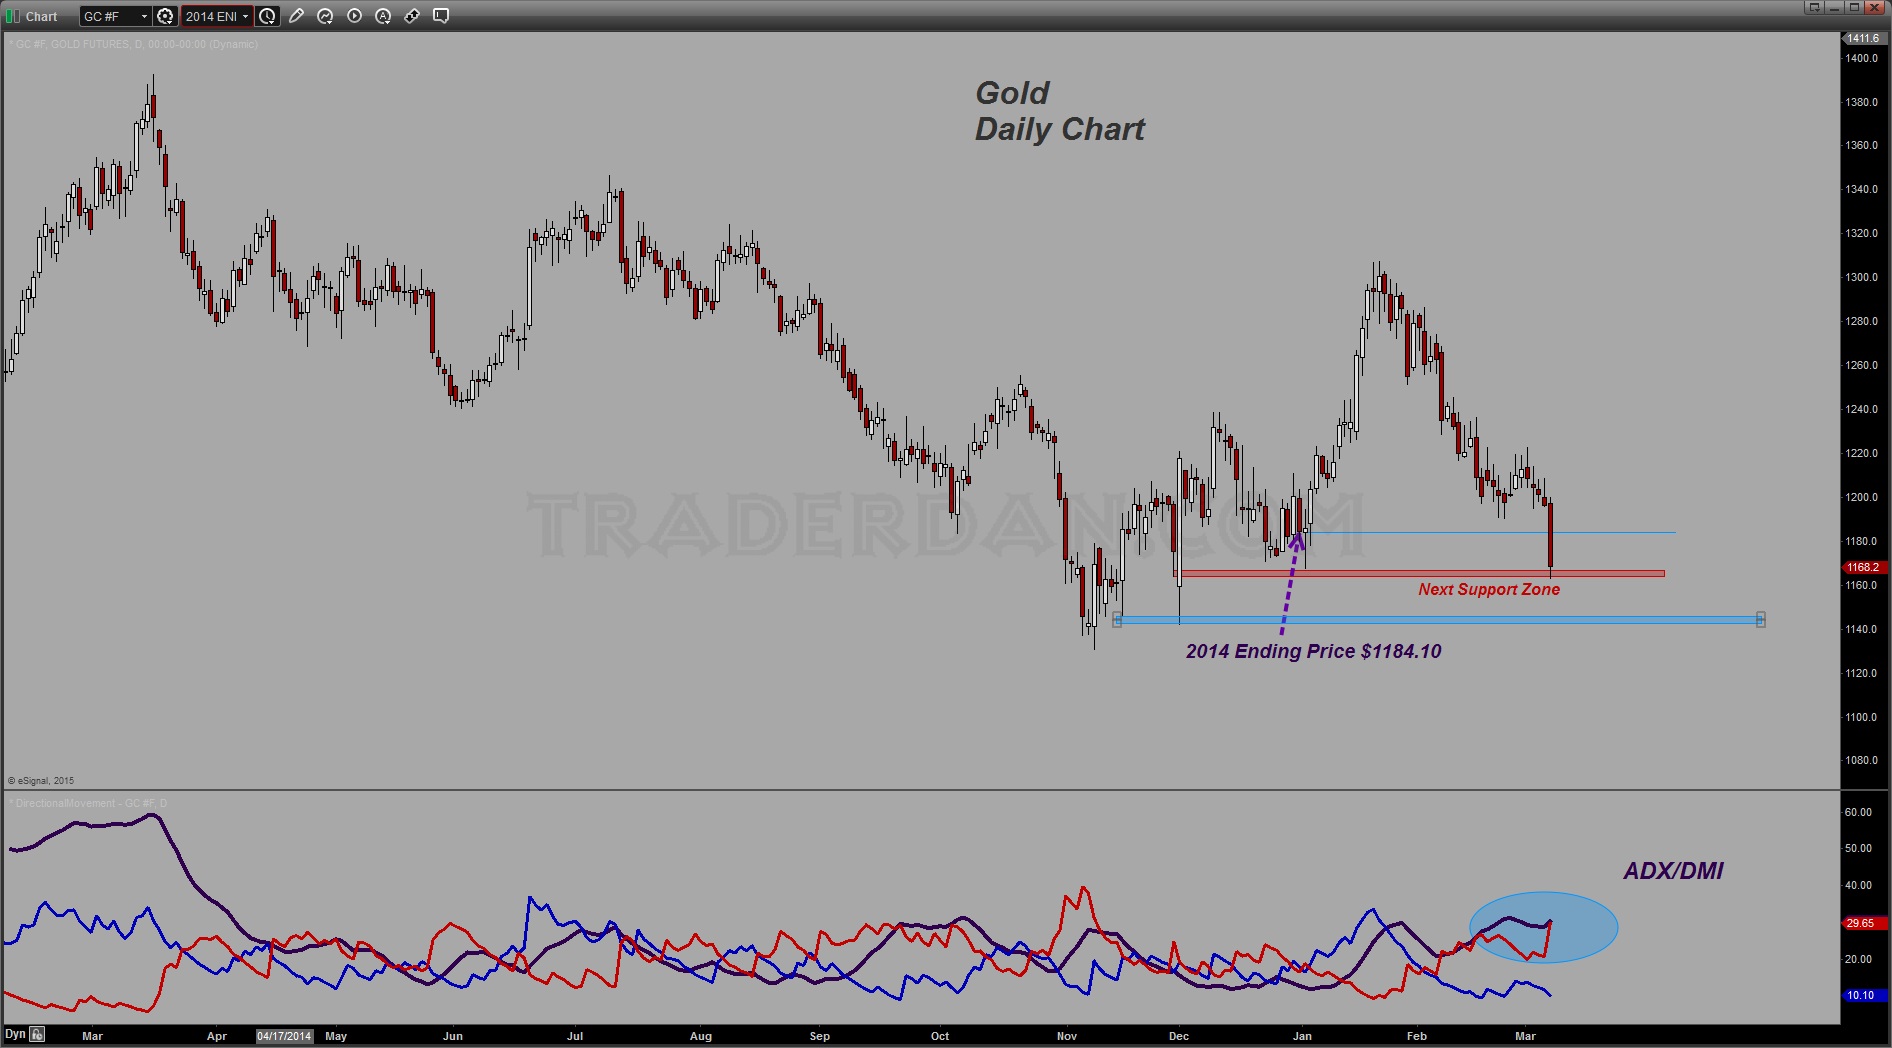
Back to the chart – the ADX line has resumed its higher move after a brief interruption occurred the last week of February. That indicates the down-trending move is back in force until proven otherwise. The -DMI is strongly above the +DMI, showing the bears in control of the market.
The next support zone lies down near the $1142-$1140 level. For the bulls to have any chance of turning this around technically, they would have to clear $1230.
In looking at this week’s COT data and chart, one can see that the hedge funds still remain large net longs in this market. Even more interesting is that the category of speculators, “Other Large Reportables”, actually had increased the size of their net long position over the past reporting period. OUCH!
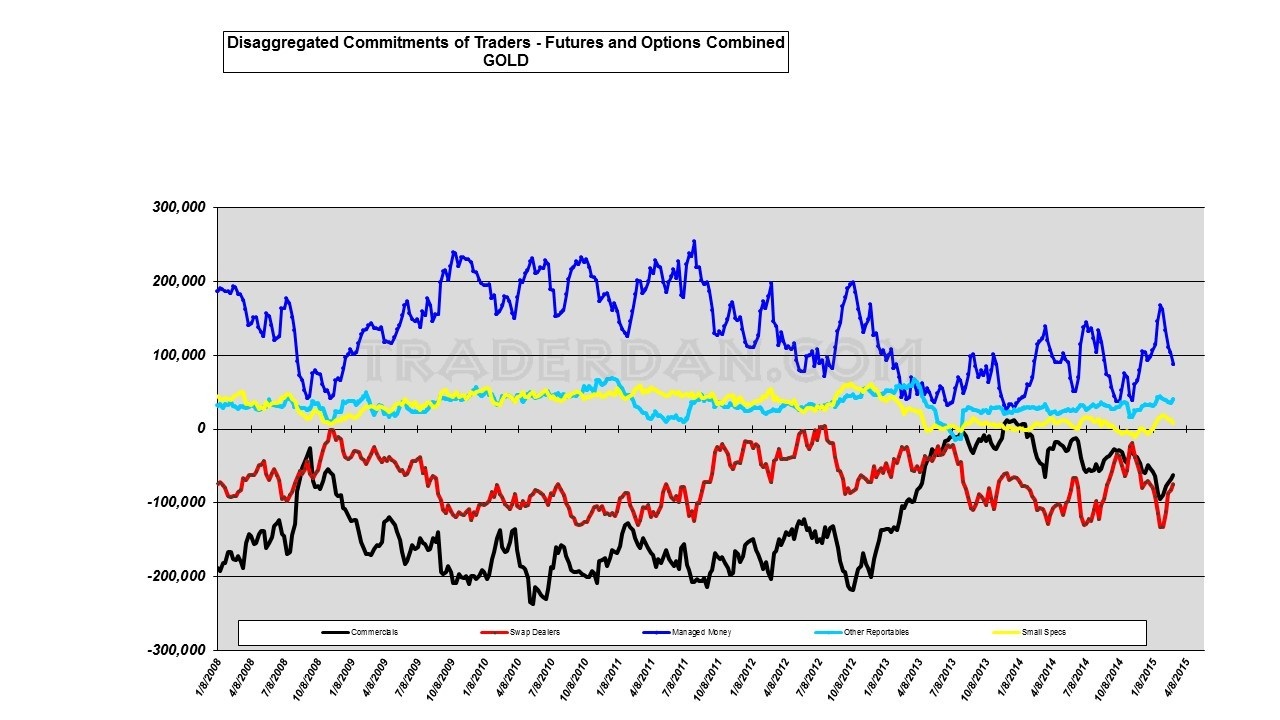
The small speculators began bailing out of the long side and adding some new short positions but still remain net long. Remember, this is through Tuesday of this week. I am very sure that the number of their long positions was cut considerably after today!

One thing I am also noting is the price level at which the entire group of speculators began to rebuild their long positions in the gold market. Look at the above chart and note the green outlined ellipses.
During the month of November last year, specs began coming back into gold in decent size. They increased their long side exposure by the equivalent of nearly 107,000 futures and options positions at their peak exposure the last week of January this year. It was that buying which took the price to up near $1300.
That recent low point in their total long positions also happens to correspond to the $1167 level on the closing gold price chart. As of today’s close, every single one of those new long positions that remain (38,000 or so), are underwater. Think about that! Now the question is, how much pain can those that remain handle? Again, some of that remaining 38,000 longs were obliterated today but I am sure a lot more still remain.
This is the reason why the support levels on the chart are now going to be very important. Below $1140, I do not see any support until the contract low near $1130. If the former level were to give way, the latter will certainly be tested. At that point, depending on the other external markets ( interest rates, currencies and equities), gold may very well take out $1130. If it does, watch for a huge number of longs to throw in the towel which will provide some hefty selling pressure.
Time will tell…
********
Courtesy of Trader Dan http://traderdan.com/


