Gold At A DANGER Point


Although gold ended the week very slightly on the up side, its roller coaster action put it into a very dangerous position. Let’s take a look at the technical picture as it ended the week.
SHORT-TERM
The short-term moving average line (black) continues to head lower despite the daily up and down price action. It doesn’t take an expert to understand that this average is telegraphing a negative message. The price remains below the moving average line.
Although not shown, the short-term Relative Strength Index (RSI), my default indicator to gauge the strength (or momentum) of the price movement, has moved into the negative zone.
Also not shown, one can draw a downward sloping parallel band which has trapped the price action since reaching its high in the second week of March.
Putting these indicators together one can only come up with a continuation of the NEG rating mentioned last week.
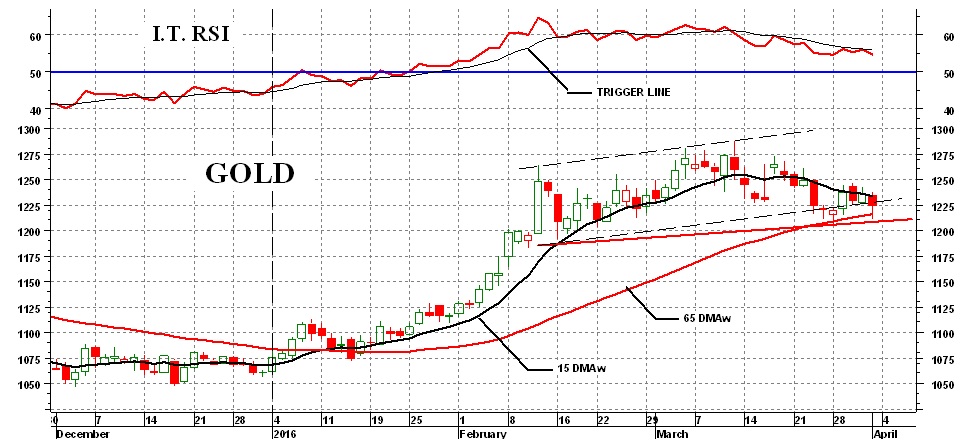
INTERMEDIATE-TERM
The basic price-momentum indicators have not changed much from last week. The price continues to tack above the intermediate-term moving average line (red), but it’s now sitting right on top of the line and could very easily drop below the line with little additional negative price action. The moving average line remains pointing upward and regardless should the price move below, it would take a significant drop, at this time, before the line turned downward.
The intermediate-term RSI remains in its positive zone but heading lower and remains below its trigger line (a short-term moving average of the momentum indicator). More seriously, the trigger line continues in a downward direction.
Putting these indicators together one can only come up with a POS rating on the intermediate-term BUT with a serious warning that the rating could change very quickly.
SO, WHERE IS THE DANGER?
Last week I highlighted the upward sloping flag, or pennant, pattern (dash lines) which results too often in a price break to the down side. The break occurred this week but only slightly. What is more worrying is that the recent price action is now tracing out a head and shoulder (H&S) pattern. I take the H&S pattern more seriously than the pennant pattern. A trend line, called the neckline, is drawn from the left shoulder to the right shoulder. It would take a move to slightly above the $1200 level to break below this neckline for a bearish, or negative signal. These H&S patterns, once broken, have a far better predictive history than the pennant. They also provide one with a suggestion of how far the move will go. Should the price break below the neckline the projection for the move would be to the $1112 to $1122 area, depending if one uses daily highs or closing prices for calculating the projection.
Last week I mentioned that my short to intermediate-term point and figure chart projected a move to the $1100 level once the price broke its $1190 support. So, it looks like gold is in a very precarious position and with very little additional downward price action, could continue to the $1100 to $1120 area for the short-term. Long-term my $920 point and figure projection from 2012 remains.
WHAT WOULD NULLIFY THESE PROJECTIONS?
From the short-term perspective, a move to the $1250 level should change the negative short-term picture while remaining above its intermediate-term moving average line should continue the positive intermediate-term rating. A move above recent highs would nullify the short to intermediate term point and figure as well as the H&S projections.
SIMPLE TUTORIALS
As you can see there is nothing here that is difficult to understand. The only difficult point in this whole analysis is the development of the RSI indicators. Unfortunately, one would need a technical software program to develop this indicator as it requires some work if one were to do it by hand. During a future simple technical tutorial to be posted on my Facebook page, I will suggest a simple indicator to substitute in place of the RSI…but one that may not be as powerful.
I expect to post a simple tutorial on moving averages on my Facebook page sometime during the coming week. Also, as I get more into being back in the analyzing mode. I hope to also have at least one individual stock analyzed during the week, again on the Facebook page. My Facebook page can be found on https://facebook.com/merv.burak.
It should go without saying that the analysis provided here is my own and provided for your information. You should check with your broker or investment advisor before acting on this or any information.
 Merv is a retired Aerospace Engineering consultant. He is also a retired market technician with over 40 years of market experience and research. Merv received his certification as a Chartered Market Technician (CMT) in 1992. Developer of many technical techniques and programs which he has been using in his previous Technically Speaking with Wil-Arm and Technically Precious with Merv commentaries posted throughout the globe. Developer of several gold and silver Indices, Merv continues to update his Merv’s Gold & Silver 100 Index and Merv’s Penny Arcade 50 Index and reviews them during his periodic on-going Technically Precious commentaries.
More from Gold-Eagle


