Gold Firm, Yet Lacking Puff


'Tis said "the market is never wrong", that instantaneously "priced-in" is everything known ... and beyond! Markets characterized as such tend to be actively liquid as is the case for Gold, the futures of which traded this past week at an average of 3.5 contracts -- each one controlling 100 ounces of the yellow metal -- per second. That's liquid.
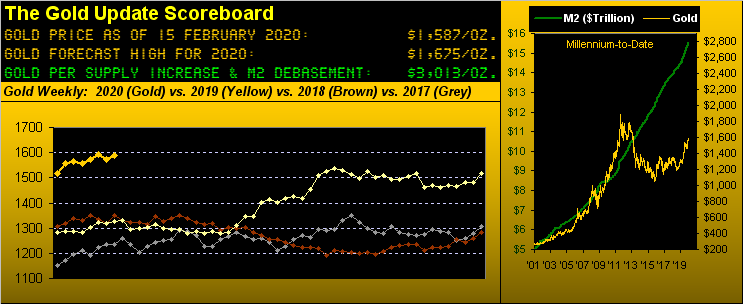
To be sure, Gold's week prior to this one just past was its worst in three months, yet such net loss of -1.2% was itself lost unnoticed in the shuffle. In other words, hardly did it stand out, as was the case for this most recent week with Gold posting a net gain of +0.8% in settling yesterday (Friday) at 1587. 'Twas initially at 1587 (within the overall run up from the lows of December back in 2015) just this past 06 January. Since that date we've had (in cinématique terms) "Assassination in Baghdad" and "Killer Virus", both box office blockbusters abruptly sending Gold spiking only to see price then settle back to where 'twas. The point is: given "the market is never wrong" and that everything is "priced-in", both referenced films -- and they're quite serious -- are being taken in stride, the market telling us they'll (thankfully) be resolved, fade from the newswires, and we'll move on to the whatever the next event may be. Indeed as we write, another asteroid "near-miss" is passing us by thus keeping at bay the ultimate headline: "World Ends, Dow +2". Moreover, Gold's net change since 06 January is essentially "unch". Ho-hum.
Fact is, prior to 06 January, the last time Gold traded above the present 1587 level was nearly seven years ago on 10 April 2013, (just prior to it all going wrong). Does anyone recall the US money supply as measured by M2 on that day?
"$10.57 trillion, mmb."
Well done, Squire. And today 'tis 47% higher at $15.54 trillion. Were Gold higher in tandem "as it ought be" by same, price today would be 2333. And that is modest per The Gold Scoreboard at the top of these missives by which present valuation is over 3000. As we thus oft query: "Got Gold?"
What we've got for Gold at present is its attractively ascending parabolic Long trend in looking to the weekly bars from a year ago-to-date. To reach down to the steadily streaming blue dots would require Gold to trade below 1501 in the new week; we rather doubt 'twill so do -- even in this new year -- especially given our forecast high for 1675:

That anticipated, 'tis rather unusual to uncover this case of strange bedfellows all trending somewhat together. Year-to-date, the S&P 500 is +4.6%, the Bond is +4.5%, Gold is +4.4% and the Dollar Index is +3.0%. Yer gonna have to break out the Britannica to research any prior stretch of such phenomena. But 'tis not a stretch in viewing the percentage tracks of Gold vs. the S&P from one month ago-to-date (21 trading days) to note their combined picture is that of an easterly-gazing camel. "Oh hello, Omar, Sugar? One hump, or two?":
An easternmost hump may be in the making for our Economic Barometer, this past week's reports coming in comparably namby-pamby across the board. One bright -- and perhaps telling -- spot was the University of Michigan's Sentiment Survey topping the 100 level for the first time since last June. The Survey has not consistently stayed above 100 whatsoever (on the few occasions it has been that high at all) since the months leading toward the (deep breath) DOT.COM crash into the turn of the millennium. And you know how it is with sentiment: when everybody's feelin' great, come time to sell, we're all too late:
And yet through it all, nobody's throwing in the equities towel. As we penned a week ago with respect to the S&P 500, "...money is being thrown at this market..." Have a look at this next graphic from the website: in the upper panel, the red line is the cumulative change in the S&P 500 from a month ago-to-date (+91 points); the blue line is the cumulative change in the S&P's moneyflow (+286 points). The interpretation thus per the lower panel is that the S&P "ought be" +195 points higher than 'tis! And having tracked this comparative analysis for better than 14 years, the moneyflow, at least directionally, will out. 'Course the big "Uh-Oh..." is that earnings, too, will out. And the earnings ain't there. A battle royale, mes amis: the mo-mo from the money managers versus the no-dough from the income statements. How's that price/earnings (trailing 12 months) ratio workin' out for ya from General Electric (563x)? Or from FedEx (548x)? Ford Motor (277x)? Aren't these supposed to be "blue-chips"? Well, there's always that for good ole Salesforce (196x). Have a nice day:
To Gold and the two-panel graphic of its daily bars from three months ago-to-date on the left and 10-day Market Profile on the right. The baby blue dots of linear regression trend consistency are looking a bit squeamish through here, lost, directionless, lacking puff. Per the Profile, the 1570s now appear as the dividing line toward maintaining the rally, else concluding it:

As for Silver, one only need note the still historically-high Gold/Silver ratio -- 89.6x -- to know she's not keeping pace with Gold. Here are her like panels to Gold, but the performance therein unlike that for Gold. The yellow metal's 21-day regression trend is up; the white metal's is down, her own "Baby Blues" depiction as presently patternless as is possible; and her price per the Profile is trapped within the 17.75-17.65 support shelf. Poor ole Sister Silver!

Time to stack it all up for Gold with...
The Gold Stack
Gold's Value per Dollar Debasement, (from our opening "Scoreboard"): 3013
Gold’s All-Time High: 1923 (06 September 2011)
The Gateway to 2000: 1900+
Gold’s All-Time Closing High: 1900 (22 August 2011)
The Final Frontier: 1800-1900
The Northern Front: 1750-1800
2020's High: 1613 (08 January)
Gold Currently: 1587, (expected daily trading range ["EDTR"]: 15 points)
On Maneuvers: 1579-1750
Trading Resistance: (none, per the Profile)
Trading Support: 1577 / 1571 / 1562 / 1558
10-Session “volume-weighted” average price magnet: 1572
10-Session directional range: down to 1551 (from 1599) = -48 points or -3.0%
2020's Low: 1520 (02 January)
The Weekly Parabolic Price to flip Short: 1501
The Floor: 1466-1579
Le Sous-sol: Sub-1466
The Support Shelf : 1454-1434
The 300-Day Moving Average: 1407 and rising
Base Camp: 1377
The 1360s Double-Top: 1369 in Apr '18 preceded by 1362 in Sep '17
Neverland: The Whiny 1290s
The Box: 1280-1240
We wrap it for this week with these quick quips:
■ Say "Sayonara!" to SoftBank? Their recent earnings purportedly plummeted some 99%. Fortunately, the share price only fell from the 26s into the 24s. (See above commentary on earnings).
■ America's 128 million households now carry record-setting debt of some $14 trillion; do the math and that works out to $109,000 per household; median annual household income before everything is $59,000; after everything? "Negative, captain..."
■ Own some shares of Delta? Your company is to invest $1 billion to curb the climate impact of global air travel. This one definitely warrants a "before and after" study.
Warranted as well is owning some Gold! "The only way to fly!"
www.deMeadville.com
www.TheGoldUpdate.com
********

Mark Mead Baillie has had an extensive business career beginning in banking and financial services for two years with Banque Nationale de Paris to corporate research for three years at Barclays Bank and then for six years as an analyst and corporate lender with Société Générale.
For the last 22 years he has expanded his financial expertise by creating his own financial services company, de Meadville International, which comprehensively follows his BEGOS complex of markets (Bond/Euro/Gold/Oil/S&P) and the trading of the futures therein. He is recognized within the financial community of demonstrating creative technical skills that surpass industry standards toward making highly informed market assessments and his work is featured in Merrill Lynch Wealth Management client presentations. He has adapted such skills into becoming the popular author each week of the prolific “The Gold Update” and is known in the financial website community as “mmb” and “deMeadville”.
Mr. Baillie holds a BS in Business from the University of Southern California and an MBA in Finance from Golden Gate University.
More from Gold-Eagle


