Gold Forecast: Cycles Move Into Topping Range


 From my last article posted in late-March, Gold was in the midst of a larger uptrend, which was expected to hold up into the early-to-mid April timeframe. With that, we are now in the range for a correction for the yellow metal, though one favored to end up as a countertrend affair - against a much bigger upward phase.
Gold's 72-Day Cycle
The last key bottom for Gold came from our 72-day time cycle, which is currently the most dominant cycle for this market - and which bottomed out back in mid-February. From that low, we projected (in advance) a 10-14% rally to play out into April, which has easily been met.
Here again is that 72-day cycle:
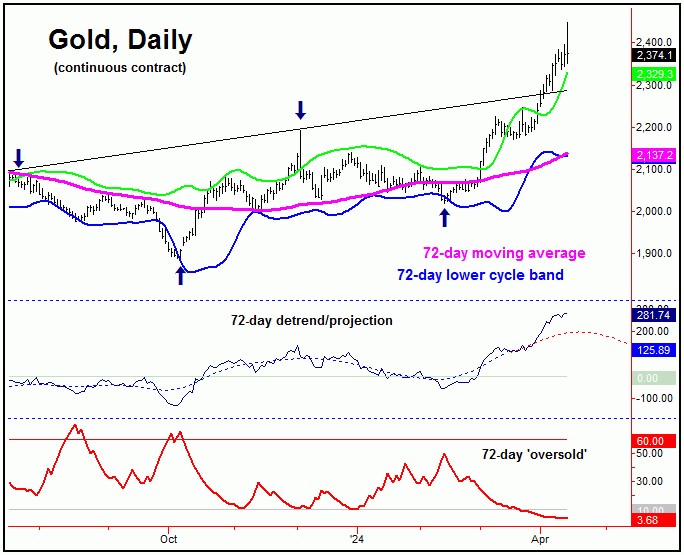
In terms of time, the average rally phases with this 72-day wave were noted as having taken 39 trading days before topping, which favored higher highs into April 9th or later. With that, the highest high seen was Friday's (April 12th) peak of 2448.80, which puts us into the expected topping range with this cycle.
As mentioned in my last article, once this 72-day wave turns, a decent correction should be expected to unfold. The downside 'risk' to that correction looks to be at or near our 72-day moving average and/or the lower 72-day cycle band, each shown on the chart that tracks this wave.
Technicals Point to Potential Peak
With the above said and noted, there is at least the potential for Friday's spike up to the 2448.80 figure (June, 2024 contract) to end up as the expected high for our 72-day cycle. This is due to the position of certain technical indications that we track, with the most noteworthy being our Gold Timing Index, shown on the next chart:
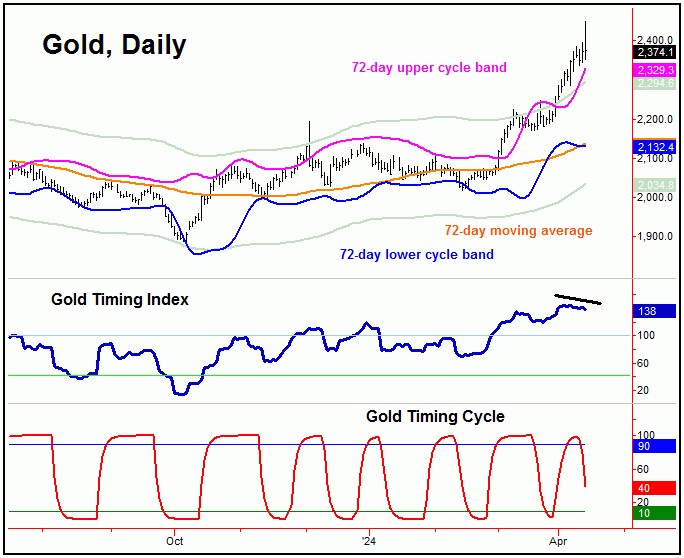
With the most recent spike to higher highs for Gold, of note is that our Gold Timing Index (in dark blue) managed to register a minor divergence, which is key - and is something we would expect to see near a peak of 72-day degree (or higher). This is particularly true, when price is trading above the upper 72-day cycle band (in magenta).
Adding to the notes above, in the lowest pane (red) we have our new Gold cycle indicator, which last dropped below its lower (buy signal) reference line at the March 25th close of 2198.20. That signal remained in place until April 5th, with the indicator moving back above its upper reference line - and closing that day at the 2345.40 figure.

With the most recent action, our Gold Cycle indicator is currently dropping, and could move back below its lower reference line in the coming days - thus setting up the next short-term bottom for the metal.
All said, we have a potential peak in place with our 72-day time cycle, though this has yet to actually be confirmed. This would require a push below a key price 'reversal point' that tracks this wave - with the exact details noted in our Gold Wave Trader market report.
Gold's Bigger Picture
For the bigger picture, a correction phase with our 72-day wave - if seen going forward - is anticipated to end up as countertrend, holding well above the mid-February low of 2018.20, the prior 72-day trough.
Support to the coming 72-day cycle downward phase would be at or near the aforementioned 72-day moving average, and/or lower 72-day cycle band - both well below current prices. If correct, we would expect a push back to higher highs - in another rally of some 10-14% or more - playing out into the Summer of this year. That rally would be the technical setup for the next mid-term peak in Gold, coming from a larger 310-day cycle - which we will take a look at again in a future article.
Jim Curry
The Gold Wave Trader
Market Turns Advisory
http://goldwavetrader.com/
http://cyclewave.homestead.com/
********
More from Gold-Eagle


