Gold Forecast: Gold Cycles Higher, Key Peak Forming


 From my prior article from mid-March, Gold had broken out to the upside - but was in the midst of a smaller-degree dip, a move expected to end up as countertrend. This was the case, with the metal having broken on back to higher highs for the swing, as favored. While higher numbers should still be in the cards near-term, Gold is setting up for its next key price top.
Gold's 72-Day Cycle
The last low of significance came with our 72-day time cycle, which bottomed back in mid-February of this year. From that low, we were expecting a sharp rally to play out, which we are currently in. Here again is our 72-day cycle in the Gold market:
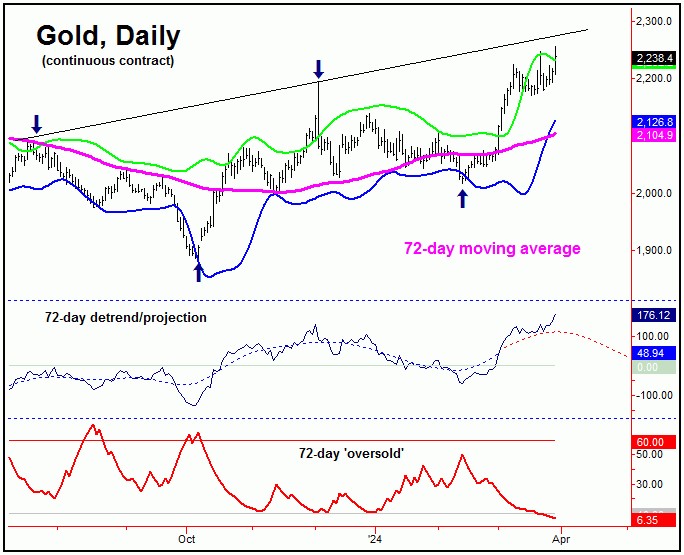
This 72-day cycle component was projected to bottom into the late-January to mid- February region - as shown by our 72-day detrend indicator, which is still pointing slightly higher at the present time.
In terms of time, the average rally phases with this 72-day cycle were noted as having taken 39 trading days before topping, which suggested the potential for higher highs into early-April or later. I mentioned then, the potential for a push up to the 2230-2260 region (for the April contract) - which the recent action has now satisfied.
With the price assumptions having already been met - and with the time assumptions drawing near - we will be on the lookout for the next peak for this cycle. Once this 72-day wave does top out, we should see a decent correction playing out in the weeks to follow, one which is something in the range of 8-10% off the highs - with the 72-day moving average providing a normal magnet.
In terms of price, we look to our downside 'reversal points' to tell us when this 72-day wave has topped. As of the current writing, the next downside reversal point figure has yet to materialize - but should soon develop - and will be posted in real-time in our thrice-weekly Gold Wave Trader market report.
Technical Considerations
With the recent break to higher highs in Gold, we like to look at any technical signs of a peak forming, with the first of these coming from our Gold Timing Index, shown on the middle pane of the chart below:
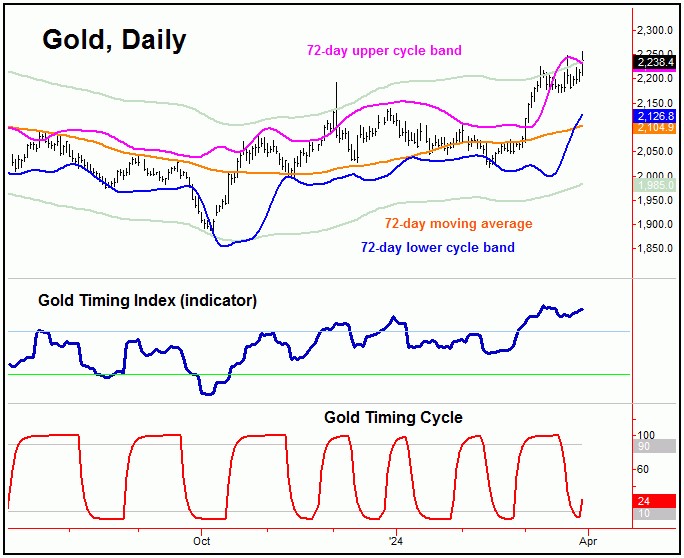
With the above, our Gold Timing Index is well above its upper reference line of 100, and is something we might expect to see at a peak with our 72-day wave. Having said that, it is too early for this wave to actually top out, and thus this will be more critical the further we move past the first week or so of April.
On the lower pane (in red) we have a new Gold cycle indicator. When this indicator drops below its lower reference line, we would expect the metal to be closer to a bottom - and thus a short-term 'buy' signal. This occurred on Monday of last week, with Gold closing that day at the 2198.20 figure (June, 2024 contract).
With the above said and noted, a push back above the upper reference line with our Gold cycle indicator - if seen in the days ahead - would be viewed as a short-term 'sell' signal for Gold, in light of the position of our (aforementioned) 72-day time cycle.
Gold's Bigger Picture
From the comments made in past articles, the overall assumption favored Gold to be in the midst of a 20%+ rally off the October, 2023 bottom, coming from our next larger wave, the 310-day component:
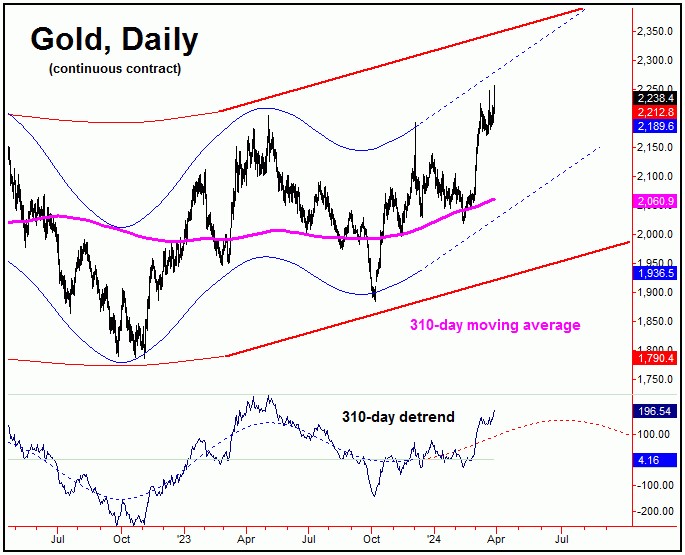
As mentioned, our 310-day cycle last bottomed back in October of 2023, and with that has been seen as pushing higher into late-Spring to early-Summer of this year. In terms of price, I have mentioned in past articles the potential for Gold to reach up to the 2270-2300 region, simply based upon the average (20%) rallies with this wave.
Stepping back then, a 72-day cycle top in April - if seen as noted - would be favored to give way to a countertrend correction in the weeks to follow, one that remains well above the February trough for this wave. If correct, what follows should be another sharp rally of some 10-14% playing out on the next 72-day cycle upward phase.
Stepping back further, a countertrend correction with our 72-day cycle - one which gives way to higher highs into early-Summer - should eventually top our bigger 310-day cycle once again, for what is expected to be a larger-degree decline into early next year. More details on how we are expecting this decline to unfold we will posted in future articles, and in real-time in our Gold Wave Trader report.
Jim Curry
The Gold Wave Trader
Market Turns Advisory
http://goldwavetrader.com/
http://cyclewave.homestead.com/
********


