The Gold Flash Crash


US Dollar Lost Soul Chart
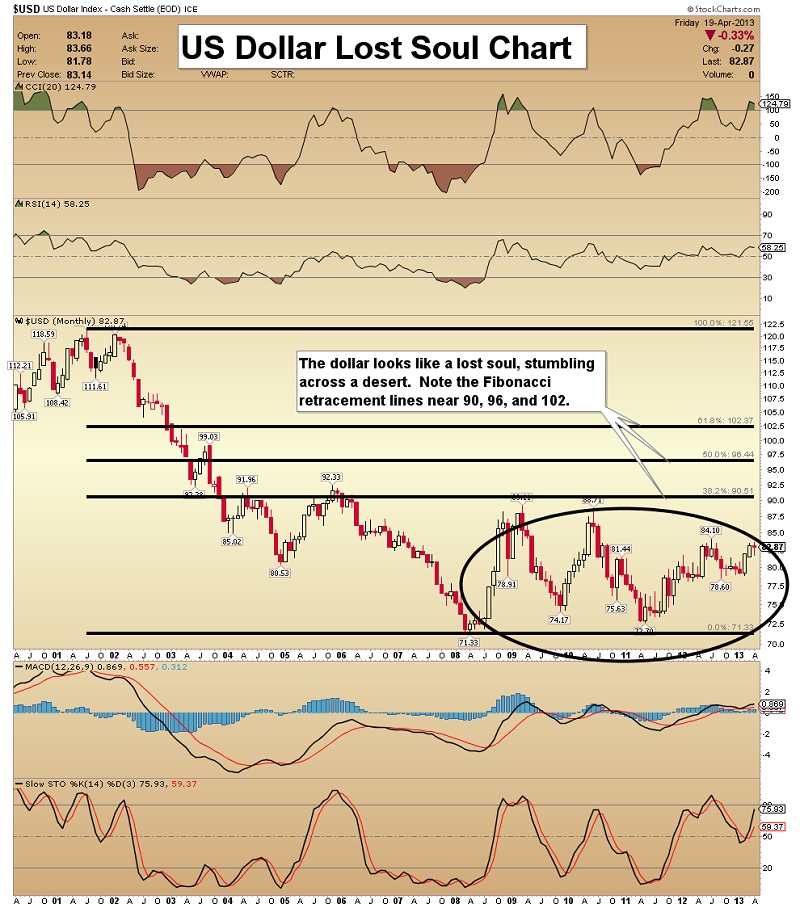
- To gain perspective on a currency, it is necessary to consider the longer term point of view. The US dollar continues to be diluted, and the US economy cannot function without large amounts of liquidity.
- The current QE program involves printing money at the astounding rate of $1 trillion dollars per year. And Fed governor Bullard said this week that he is in favor of increasing it.
- When you look back 12 years, it’s clear that the dollar is gradually being debased. Note the Fibonacci retracement numbers that I’ve highlighted on this monthly chart.
- Even if the dollar were to rally to the 100 area, it would not change the primary trend, which is down. The dollar is like a lost soul wandering across a desert. Austerity, not QE, is the drink of water that my country’s fiat currency needs.
Gold Fibonacci Arc Chart
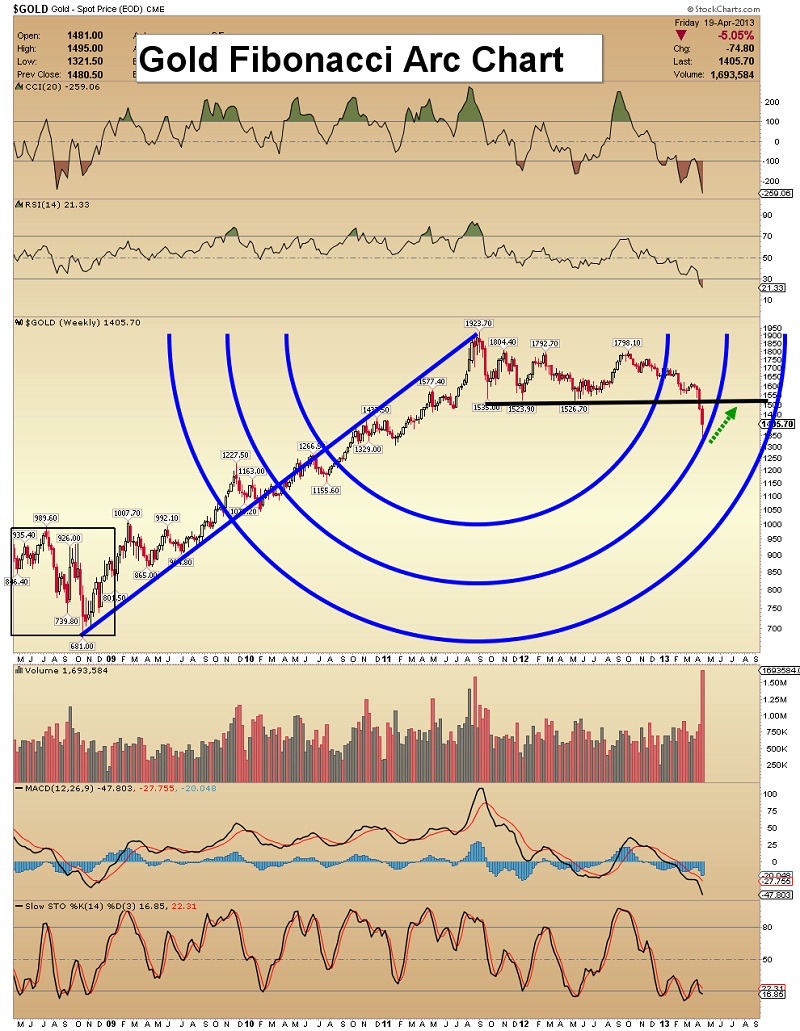
- Any correction like the one that just happened in gold, is enough to shake even the staunchest bull’s confidence. Investors must think carefully about why they own physical metals.
- There has been a party on Wall Street, driven by liquidity, not economic growth. The US economy is addicted to stimulus. More citizens are applying for government handouts. This is not how to build a strong currency. Gold ultimately moves in the opposite direction to the dollar. So, own gold. Physical gold.
- I have identified Fibonacci support areas on this gold chart. $1302 is the 50% retracement line, and gold stopped declining at about $1320.
- Also, RSI is very low. Although gold looks like it is bottoming here, I am watching the $1260 area carefully, which also offers very good support. This market seems very similar to 2008, where a V-type bottom was made, and prices quickly moved higher.
Gold Shakeout Chart

- My $1350 “shakeout” target was acquired. From either the current $1320 area lows, or from $1250, I am projecting a slow grind higher, towards the $1500 resistance area.
- Even large banks have said that this flash crash is “overdone”. The gold market is far from safe, but it does offer value.
- Tonight’s COT report is critically important. It covers all the trading that took place during the flash crash, for both gold and silver. Send me an email to [email protected] and I’ll send you the multi-part video analysis I will be doing tonight. I believe that tonight’s COT report is the most important one, in the history of this bull market. It could show investors whether the gold bull has simply paused, or the bear has really taken over!
HUI Arc Chart
- Several weeks ago, I mentioned the 250-300 support area on the HUI chart, as a possible target price. That target was acquired.
- What I want to see now, on the upside, is a price advance on heavy volume. On the downside, the next area of support is the 175-150 area.
- Compared to gold, most gold stocks are now cheaper than they were at the low of the 2008 market bottom.
- Note how close the HUI is now, to the 3rd and largest Fibonacci arc, on this chart. Strong rallies can occur from this type of set-up.
GDX Filling The Gap Chart

- Whether you are a bull or a bear, I think the next price objective for GDX is the top of the gap in the $32.50 area.
- Bulls should buy now, with a $32.50 target, and bears could place some light short positions around $32-$33.
- Note the massive panic volume. There’s a chance that an “ultimate low” is here, but the bottom callers (including me) have been wrong so many times, we look like a bear’s Swiss cheese sandwich.
- Regardless, the use of proper money management techniques has allowed professional gold stock accumulators to continue to buy this carnage, with a reasonable degree of comfort. Never allocate large amounts of money to any single trade.
GDXJ Channel Backtest Chart
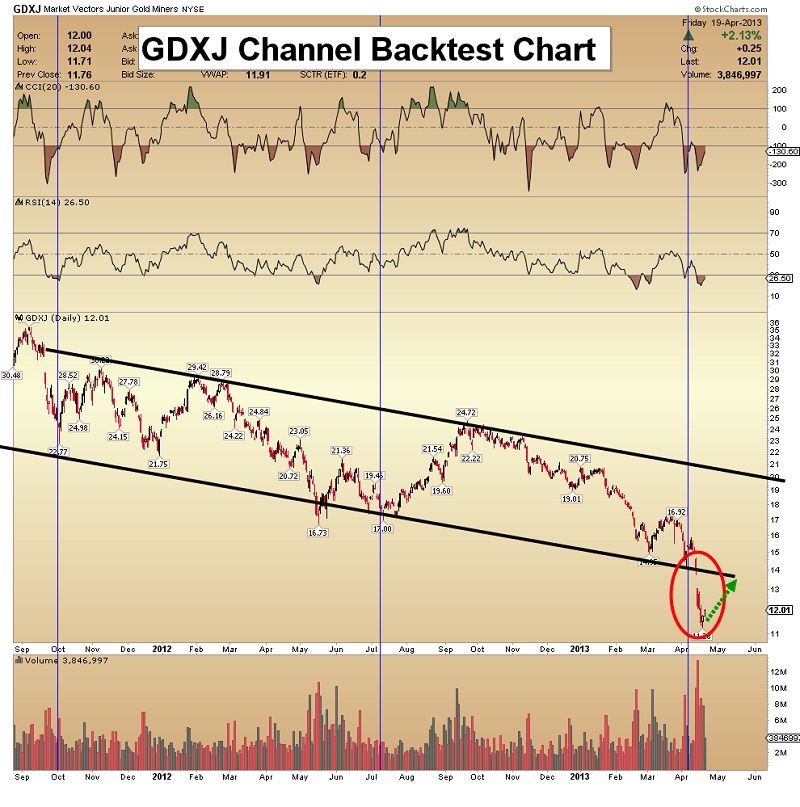
- In this secto, unless you are an aggressive trader, this is a time to stand back and let the dust settle, in this sector. If you are an accumulator, this type of weakness must be bought, but preferably only “after the dust settles”.
- I’m looking for a rally back to the downtrend channel line, in the $13.50 area.
- From there, I’ll be watching the volume patterns. Volume must start increasing, if junior stocks are going to put on a substantial rally.
Silver Support Zone Chart 
- This week, silver has come down, like many other assets. Having said that, none of the bars I own have gotten any smaller!
- Perhaps the main lesson from this huge “flash crash” is that investors need to think carefully about how much leverage to use, when purchasing silver.
- When the support at $26 failed, it was disappointing, but there is good support in the $19-$23 area, too.
Unique Introduction For Gold-Eagle Readers: Send me an email to [email protected] and I'll send you 3 of my next Super Force Surge Signals, as I send them to paid subscribers, to you for free. Thank-you!
Stay alert for our Super Force alerts, sent by email to subscribers, for both the daily charts on Super Force Signals atwww.superforcesignals.com and for the 60 minute charts at www.superforce60.com
About Super Force Signals:
Our Super Force signals are created thru our proprietary blend of the highest quality technical analysis and many years of successful business building. We are two business owners with excellent synergy. We understand risk and reward. Our subscribers are generally successful business owners, people like yourself with speculative funds, looking for serious management of your risk and reward in the market.
Frank Johnson: Executive Editor, Macro Risk Manager.
Morris Hubbartt: Chief Market Analyst, Trading Risk Specialist.
[email protected]
[email protected]
Super Force Signals
422 Richards Street
Vancouver, BC V6B 2Z4
Canada


