Gold Forecast: Gold Cycles Direct Hit, More Upside To Come


 Recapping Last Week
Last week's action saw gold forming its low for the week in Monday's session, here doing so with the tag of the 1813.80 figure. From there, a strong push higher was seen into late-week, with the metal running all the way up to a Friday high of 1871.40 - also managing to end both the day and week at or within earshot of the same.
Gold's 3-6 Week Forecast
From last weekend: "our expected short-term bottom is now confirmed to be in place, an action which favors additional strength in the days/weeks ahead. This is right in line with our overall assessment of the market - which has been looking for the larger-degree cycles to push higher into mid-to-late November."
As mentioned in recent articles, the last short-term decline for gold was expected to end up as a countertrend affair - due to the configuration of the larger-degree waves. With that, our ideal path was looking for the metal to push back above the 1836.90 swing high, though - in our Gold Wave Trader report - we noted a push on above our upper 154-day cycle band (chart below) to be ideal:

From the comments made over the past month, this 154-day cycle - as well as the smaller 72-day wave - were projected higher into the mid-to-late November timeframe or later. This action told us to expect any short-term decline to end up as countertrend, to be followed by higher highs, upon completion - which we have easily seen met with the action into last week.
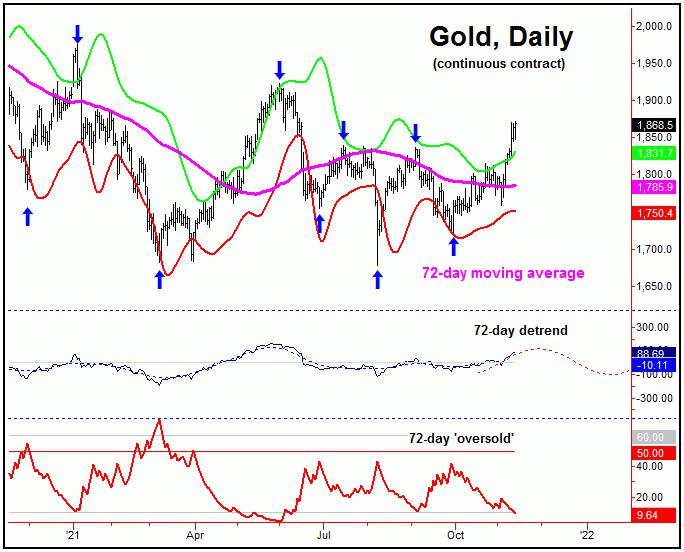
Resistance to the current move up won't come in until the 1895-1930 region for gold (December, 2021 contract), once again with any smaller-degree decline(s) expected to end up as countertrend - with support around the low-end 1800's. With that, the overall path favors higher highs into later this month, before the next key swing top forms - coming from the smaller 72-day wave, shown below:
With the above said and noted, higher highs into the late-November timeframe - if seen as expected - should end up topping our smaller 72-day cycle, for what is favored to be a correction into mid-to-late December. In terms of patterns, due again to the position of the aforementioned 154-day wave, the probabilities tend to favor that decline to end up as another countertrend affair.
With the recent action then, gold has met our expected targets - spiking above the upper 154-day cycle band early in Wednesday's session. With that, each of our targets have now been met, and nothing else is required for the current upward phase. However, as noted, the probabilities should favor the next downward phase of the 72-day wave to end up as countertrend, into a December low.
In terms of price, the next downward phase of the 72-day wave into December should see the 72-day moving average acting as a normal magnet - wherever it is at the time. In terms of patterns, that decline would be favored to remain above the 1721.10 figure, the last 72-day trough - and may well hold above the most recent swing low of 1758.50, with support around the lower 72-day cycle band.
Stepping back further, as long as the 1721.10 figure is able to contain the next 72-day cycle downward phase into December, the probabilities are above-average that the next upward phase of this wave will take gold back to or above the highs again into early next year, before topping the larger 154-day wave.
Supporting evidence for additional strength into early next year comes from our long-term momentum indicator for gold, which is shown on the chart below:

With the action seen in recent weeks, our long-term momentum indicator has managed to turn back to the upside, after turning south following the June price peak. This indicator - once it turns - tends to signal a multi-month directional change for gold. Thus, the turn higher with this indicator supports the idea of continued strength into early next year, though with the normal up-and-down corrections in-between.
Gold: The Bottom Line
The overall bottom line with the above remains as it has over the past month or so, which has the larger 72 and 154-day cycles pointing higher, with the upward phase of the larger wave favored to remain intact into at least early next year. In-between, there is likely to be a correction with the smaller 72-day cycle into December. That move should end up as a countertrend affair - giving way to higher highs on the next swing up, before the next 154-day peak attempts to form. Stay tuned.
Jim Curry
The Gold Wave Trader
http://goldwavetrader.com/
http://cyclewave.homestead.com/
********


