Gold Investors Wrongly Fear The “COT”
 share
share
 share
share
 share
share
 share
share
 share
share

As a student of market history, I always find it interesting, and even sometimes quite comical, how certain fallacies about markets are continually propagated by investors and analysts alike. Throughout my career in writing about metals, I have tried to bring many of these to light, and explain why so many of the fallacies should be ignored.
The latest in the string of fallacies relates to the Commitment of Traders report (COT). The common argument suggests that as long as the commercial traders are shorting gold heavily, then gold cannot rally. And, much has been made of late regarding the heavy commercial short positions pointing to a major drop in the gold market. Yet, history suggests otherwise.
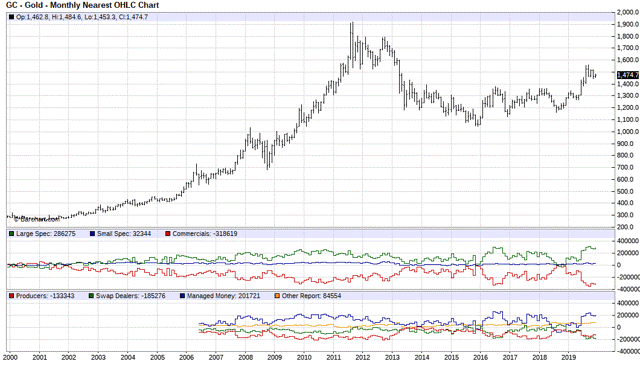
If you look at the attached chart for the last 20 years, you will see that during the parabolic rally of 2010-2011 in the price of gold the commercial traders were heavily short gold. In fact, you can see that during that entire period of time, commercial shorts remained at 200,000 or greater. Yet, that was during a period of time where the price of gold rallied $800. For those counting in percentage terms, that means gold rallied 70%+ during a time where commercial traders were heavily short of gold.
You see, just like technicals have to be read differently during bull markets versus bear markets, so does the COT. During bear markets, when the technicals reach an overbought level, then it often suggests the market will likely begin a selling phase. However, in a bull market, when the technicalsreach an overbought level, rather than suggesting selling will result, the technicals often embed during the strong advance of a bull market. The same will often happen with the COT. So, applying a linear expectation to the COT data will not often result in the appropriate trading result.
This really means that support and resistance are much more important to metals investors/traders than the COT report. Moreover, the structure of the move in the metals complex will also tell us a lot more than the COT report. Remember, history has shown us that if the market is in a bullish phase, then the COT report will be meaningless.
So, at this point in time, there are several ways you can view the COT report, if you really care about it. Either the commercial shorts will cover their shorts on the next corrective pullback I expect in early 2020 or the market will simply continue on its merry way with the commercial shorts being . . . well . . . short, no different than what we saw in 2010-2011. But, as I said, history has told us that this report is not going to provide any predictive value when the metals are in a bull phase. If we do morph into a bear phase, then it will mean a lot more. But, until we break some support (137 GLD), this report should not be heavily weighted within trading/investing decisions.
share
share
share
share
share
 Avi Gilburt is a widely followed Elliott Wave technical analyst and author of ElliottWaveTrader.net, a live Trading Room featuring his intraday market analysis (including emini S&P500, metals, oil, USD & VXX), interactive member-analyst forum, and detailed library of Elliott Wave education. You can contact Avi at: [email protected].
More from Gold-Eagle