Gold Market Update


Last week gold's major new uptrend became established when following a successful test of support at the breakout point it advanced to new highs, indifferent to temporary dollar strength. The new uptrend is expected to be at least of similar magnitude and duration to the great uptrends of 2005 - 2006 and 2007 - 2008 and if it is we are looking at very significant gains over the intermediate-term, which is certainly suggested by the recent powerful breakouts of many junior mining stocks.
Our long-term chart which shows the bullmarket in gold from early on in this decade in its entirety enables us to define a minimum target for the uptrend, as it should at least get to the upper return line of the trend channel shown. This gives us a ballpark target at about $1400 - and it could go higher depending on when it reaches this return line, and higher still of course if it should break out of the top of this uptrend in a parabolic acceleration, which is quite possible given the worsening Fiat shambles.

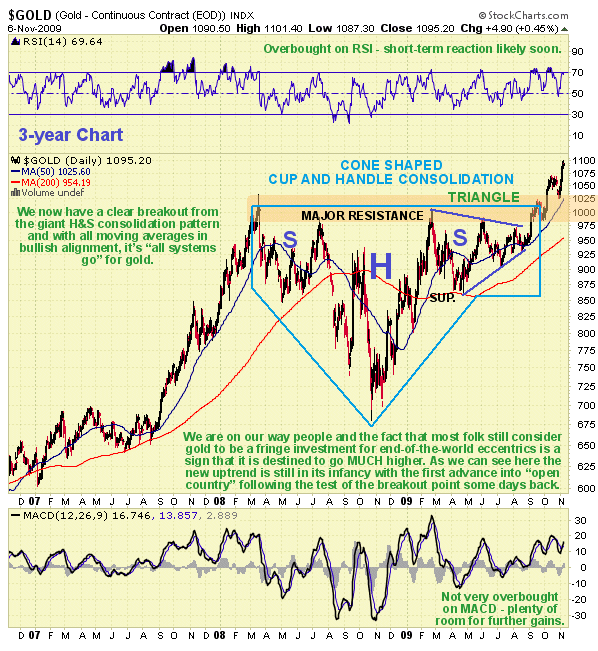
The 3-year chart enables us to review the recent giant consolidation in detail. This unusual pattern was simultaneously comprised of a Head-and-Shoulders consolidation pattern and a Cone-shaped Cup & Handle consolidation, whose "Handle" took the form of a Symmetrical Triangle. The sharp advance early last week was of the utmost importance as it took the price at last well clear of the "gravitational pull" of the giant trading range, greatly decreasing the chances that it will slump back into pattern. This advance was doubly important as it followed a successful test of support at the top of the pattern - the former strong resistance at the top of the pattern will now morph into a zone of strong support, the more so as the price climbs higher. Moving averages are in strongly bullish alignment and are supportive of a vigorous advance lasting many months during which gold will probably remain overbought much of the time on its short to medium-term oscillators, with occasional pauses or minor reactions to ease the overbought condition. The MACD indicator shown at the bottom of the chart certainly allows for further gains over the short to medium-term. There are some wave cranks out there talking about a collapse in gold soon, but it certainly doesn't look likely on this chart, and anyway someone has to be bearish, or the advance would stop.
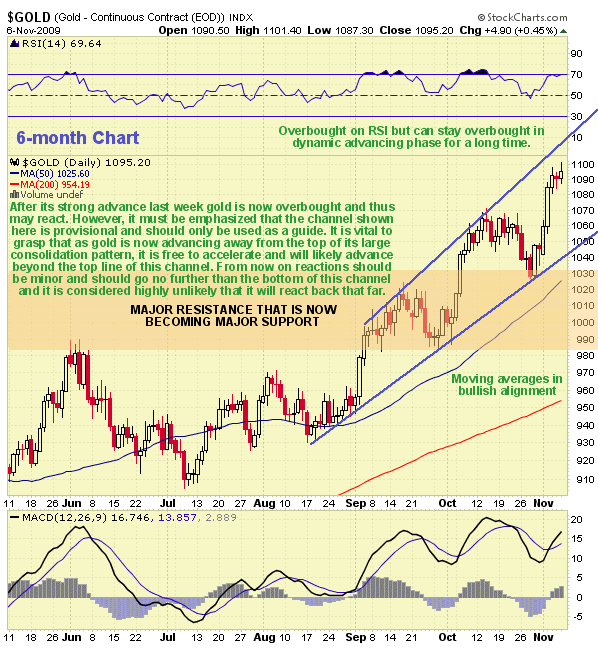
On the 6-month chart we can see how, following the breakout from the Triangle within the large consolidation pattern early in September, gold has advanced in a neat series of upwaves punctuated by orderly reactions. It was the second of these upwaves early in October that broke it out to new highs, and it was the reaction following this upwave that made the all-important test of the new strong support at the top of the giant consolidation pattern. With this test of support having been successful and followed by another upleg to new highs last week, gold is starting to get well clear of the pattern and is thus in position to accelerate away from it, which is what typically happens in this situation. It is thus clear that gold could now continue higher short-term to reach the top return line of the provisional channel shown, or accelerate beyond it before the next consolidation/reaction sets in, and while it could react back to the lower support line of the channel it is unlikely that it would drop back that far before turning up again.
At this juncture it is highly illuminating and worthwhile to look at gold in other important currencies. As we can immediately see the 3-year chart for gold in Euros looks very positive indeed. After a strong upleg early in the year gold reacted back in classic fashion to the support at the top of the previous congestion zone in the vicinity of the 200-day moving average, where a rectangular trading range formed for many months that allowed time for the moving averages to swing back into bullish alignment, and it is no coincidence that gold has broken out upside from the trading range to commence its next run just as the positively aligned moving averages have advanced towards the top of it. On this Euro chart gold is very well paced to mount an immedaite strong advance to new highs, and the MACD indicator at the bottom of this chart shows that it certainly has the leeway to do so.

Back in August we delineated some parabolic support lines for gold on the long-term Euro chart, and it is interesting to observe that it has since gained traction at the upper one, interesting because if this line continues to hold it projects a spectacular slingshot move and soon that will exceed the wildest expectations of most observers.

A massive plus for gold - and for silver - at this time is that they are still off the radar of the vast majority of investors, who innocently believe that their Fiat masters have ridden to their rescue on the recently created tidal wave of manufactured liquidity, and consider gold and silver to be the province of fringe wing survivalist eccentrics. We are thus still a long, long way from the kind of frothy public involvement that will mark the beginning of the end of the Precious Metals bullmarket.
![]() Whereas gold has forged ahead to new highs in recent weeks, silver has got bogged down working off overhanging supply, which is the price it is paying for having dropped like a rock last year, so that even though it has risen proportionally more than gold this year, it had so much ground to make up that it still hasn't broken out to new highs.
Whereas gold has forged ahead to new highs in recent weeks, silver has got bogged down working off overhanging supply, which is the price it is paying for having dropped like a rock last year, so that even though it has risen proportionally more than gold this year, it had so much ground to make up that it still hasn't broken out to new highs.
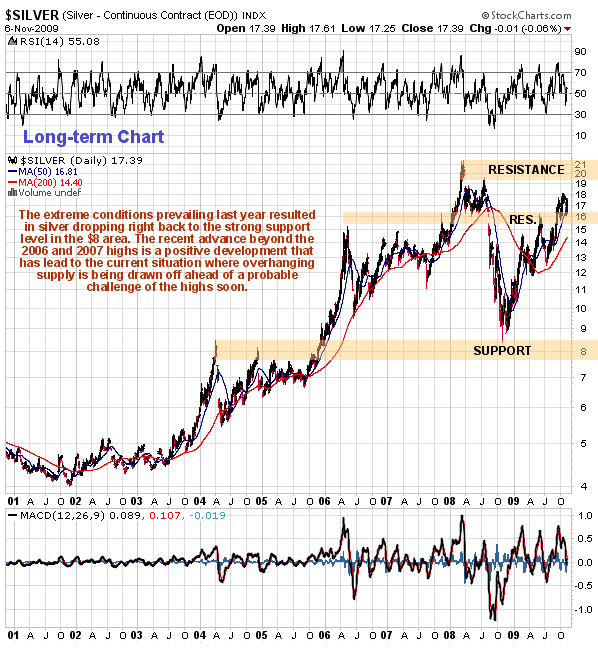
The long-term chart for silver looks chaotic compared to that for gold, not helped by the violent plunge last year which saw it drop from a high near $21 to a mere $8.50 at the low. It has spent this year to date slowly making up the lost ground which has involved it laboriously working its way through the overhanging supply set up by the plunge. The good news is that with the recent break above more concentrated resistance in the $16 area, there is now not that much more resistance to go before it breaks into the clear by advancing above last year's highs, and with gold looking set to continue to make strong gains, a breakout to new highs is probably not very far off.
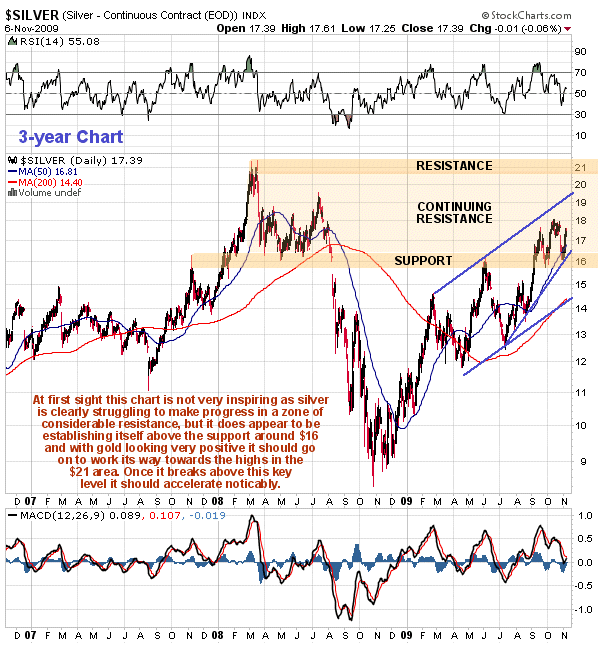
On the 3-year chart we can see the action last year and this year in more detail. This chart makes clear why silver has gotten bogged down in recent weeks and made no progress - it is because it has run into the price zone where a congestion pattern formed during the first half of last year, and buyers from that time who were seriously rattled by the crash are taking their long awaited chance to "get out even". Once their selling is absorbed - which shouldn't take much longer in a situation of continued gold strength - silver will be free to advance and challenge its highs. It was an achievement for silver to climb above and stay above the important resistance in the $16 area, which should now support the price near-term.
On the 6-month chart the pattern that has formed in silver since early September certainly looks like a Head-and-Shoulders top in the making, with the price now marking out the Right Shoulder high, but it is not thought to be a true one and is expected to be aborted by an upside breakout, although we may first see a reaction back to the support at $16. The latest silver COT chart shows a significant reduction in both Commercial short positions and Large Spec long positions, which is bullish, especially as this occurred after Tuesday's strong gains. A paradox of Technical Analysis is that while the declining oscillators as this pattern has formed are indicative of dwindling momentum that can lead to a breakdown, at the same time they show an unwinding of the earlier overbought condition that renews upside potential. Certainly a break below the support in the $16 area would be viewed as a short-term sell signal, although this is not considered to be likely at this point.

As with gold it is worth taking a look at the silver in euros chart, to see if we can glean any useful hints as to what exactly is going on. The long-term chart for silver in euros is most interesting as it is more clear than the normal dollar chart and removes some of the ambiguity of that chart. The reason for this is that there is a clear and definite zone of strong resistance on the euro chart which has turned the price back no less than five times since early 2006, although it did briefly break through it early in 2008, and silver is struggling to overcome this resistance right now. This resistance level is of such importance that once silver does succeed in breaking above it, it should have little trouble breaking above the lesser resistance at the early 2008 high after which it will be free to advance unfettered by overhanging supply. We should therefore watch this level on the silver in euros chart in coming weeks as the trigger for an acceleration in the rate of advance, a development that is considered to be highly likely given the very positive outlook for gold and the recent high volume breakouts by various silver juniors.

Clive Maund, Diploma Technical Analysis
[email protected]
www.clivemaund.com
Copiapo, Chile, 7 November 2009

Clive P. Maund’s interest in markets started when, as an aimless youth searching for direction in his mid-20’s, he inherited some money. Unfortunately it was not enough to live a utopian lifestyle as a playboy or retire very young. Therefore on the advice of his brother, he bought a load of British Petroleum stock, which promptly went up 20% in the space of a few weeks. Clive sold them at the top…which really fired his imagination. The prospect of being able to buy securities and sell them later at a higher price, and make money for doing little or no work was most attractive – and so the quest began, especially as he had been further stoked up by watching from the sidelines with a mixture of fascination and envy as fortunes were made in the roaring gold and silver bull market of the late 70’s.
Clive furthered his education in Technical Analysis or charting by ordering various good books from the US and by applying what he learned at work on an everyday basis. He also obtained the UK Society of Technical Analysts’ Diploma.
The years following 2005 saw the boom phase of the Gold and Silver bull market, until they peaked in late 2011. While there is ongoing debate about whether that was the final high, it is not believed to be because of the continuing global debasement of fiat currency. The bear market since 2011 is viewed as being very similar to the 2-year reaction in the mid-70’s, which was preceded by a powerful advance and was followed by a gigantic parabolic price ramp. Moreover, Precious Metals should come back into their own when the various asset bubbles elsewhere burst, which looks set to happen anytime soon.
Visit Clive at his website: CliveMaund.com


