Gold Needs RSI Breakout


Euro H&S Top Chart

- If the euro breaks below the 127 area, the door is open for a retest of the lows.
- When the euro rallies, so does gold. Note the head & shoulders top pattern on the chart. The target is about 119, which is not great news for gold investors.
- The public has been very bullish on the dollar, which could help to void the top pattern on the euro, but investors need to be cautious right now.
Gold Sink Hole Chart
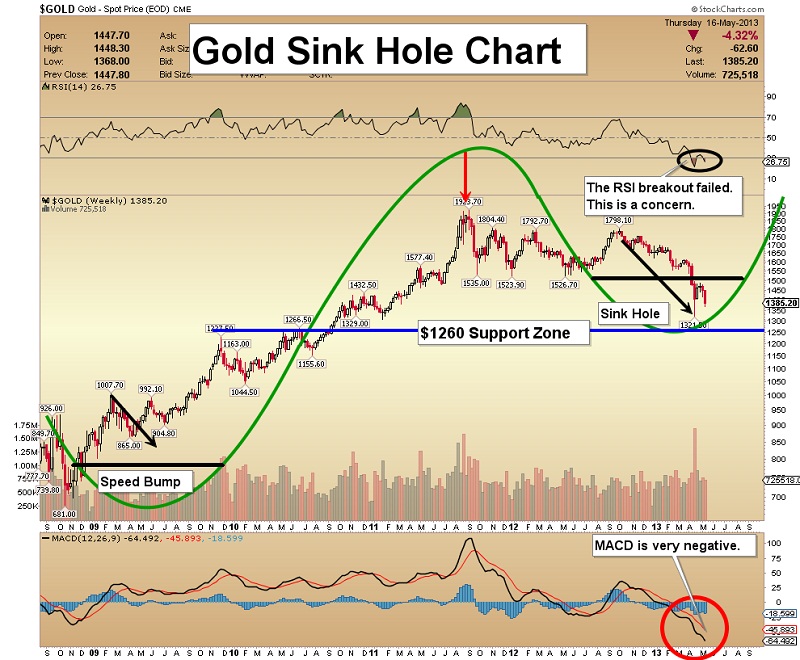
- The gold market feels like a market under attack. What should have been a “speed bump” has turned into a gigantic sink hole.
- I am watching two indicators for signs of a bottom. First, note the RSI, located at the top of the chart. A reading below 30 on the weekly chart indicates gold is tremendously oversold. A powerful rally is long overdue, but the failed RSI breakout above 30 is a concern.
- The MACD indicator is also very low, but note how the lines are widening, rather than narrowing. If gold does break to the downside, I view the $1260 area as a key support area.
- At this point, calling a bottom is pointless, but there can still be good rallies, caused by substantial short covering.
HUI Arc Chart

- The RSI oscillator is now lower than it was in 2008.
- Note the “open mouth” on the MACD indicator. MACD is also lower than it was in 2008, but it still shows no sign of turning higher.
- What would gold stocks look like if gold tested $1260? Based on RSI and MACD, I believe that 225 on the HUI index would offer good support to gold stocks.
GDXJ New Lows Chart
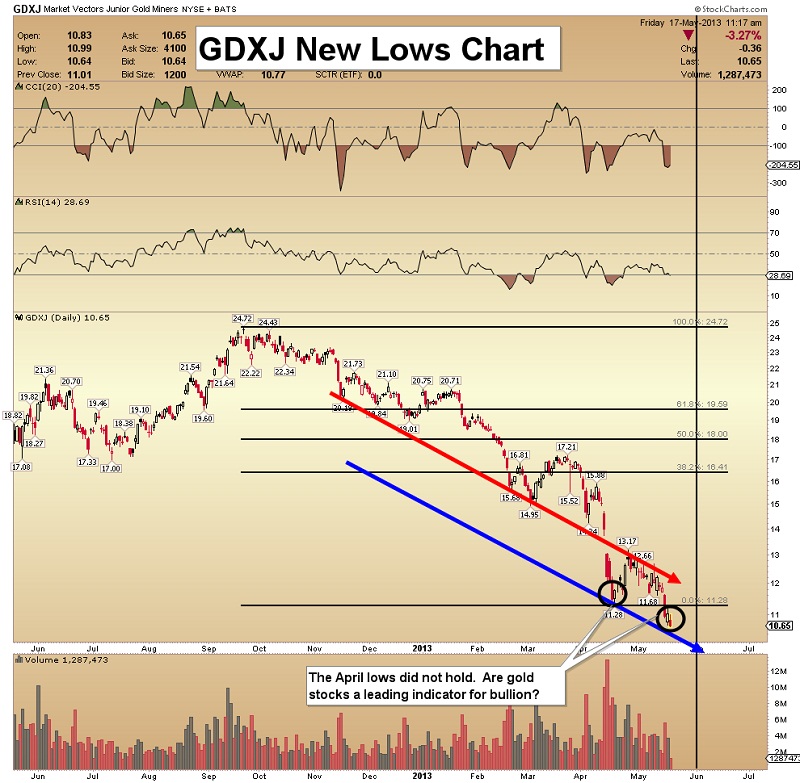
- Until the red back test line is taken out on the upside, I would like to see gold stock investors concentrate most of their buying on the senior stocks, because there is less risk there.
Silver Support Zone Chart

- Silver is volatile, but owning the physical metal eases much of the fear, when you hold it in your possession.
- The $19.50 - $21.44 price range offers great support on the buyside, and silver is trading near there now.
- As noted on the chart, RSI is oversold, but a breakout above 30 is what silver investors need!
Unique Introduction For Gold-Eagle Readers: Send me an email to [email protected] and I'll send you 3 of my next Super Force Surge Signals, as I send them to paid subscribers, to you for free. Thank-you!
Stay alert for our Super Force alerts, sent by email to subscribers, for both the daily charts on Super Force Signals at www.superforcesignals.com and for the 60 minute charts at www.superforce60.com
About Super Force Signals:
Our Super Force signals are created thru our proprietary blend of the highest quality technical analysis and many years of successful business building. We are two business owners with excellent synergy. We understand risk and reward. Our subscribers are generally successful business owners, people like yourself with speculative funds, looking for serious management of your risk and reward in the market.
Frank Johnson: Executive Editor, Macro Risk Manager.
Morris Hubbartt: Chief Market Analyst, Trading Risk Specialist.
Super Force Signals
422 Richards Street
Vancouver, BC V6B 2Z4
Canada


