Gold Is Nuthin' Whilst All Else Is Sumpthin'


Oh my, oh May, oh me. "What's happenin', baby?" With respect to Gold? "Nuthin'!"
To be sure, there've been some good earnings pops amongst the miners, but specific to the price of the yellow metal itself, the month of May thus far has been one big nuthin'. That said, the good news is -- given our recent missives citing that May for gold has been a month of malaise, demise and dismay -- Gold's price hasn't flat out tanked.
Clearly, or perhaps better stated "murkily", 'tis a tug-of-war for gold, but with very little movement in either direction, albeit its weekly parabolic trend did flip to Short a week ago. Yet elsewhere, there's plenty of sumpthin': Oil's been a-poppin', the Dollar Index for past three weeks has been rising, Mid-East tensions are as tight as they get, our best allies in the European Union are giving us the wry eye ... and are the two Koreas along with the U.S. really in that much of a loving ménage à trois? "Daaahlings, shall we rendezvous in exotic Singapore?"
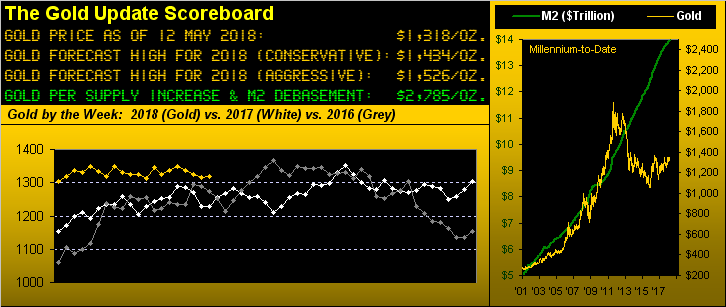
Put it all together and through these first nine trading days of May, gold presently sports an unnoticeable net gain of +0.2% (+2.3 points), settling out the week yesterday (Friday) at 1318. Indeed updating our chart of gold's past Mays through today, 2018 doesn't even register as we see here, (the red axis being thicker than the current gold bar):

In fact as we go to gold's weekly bars, their aforementioned parabolic trend now being Short, the three rightmost weeks appear as a broken record. gold's trading range in each of them has been: 21.8 points, 23.6 points, and 22.1 points respectively. And in all three cases price has settled near the center of each week's range. Remember the girl in the taupe miniskirt with the overnight bag in the bus station Goin' Nowhere"? That's gotten a lot of airplay over the years here in The Gold Update:
Note, too, the Gold/Silver ratio of 78.9x remaining historically very high given the millennium-to-date average of 63.1x, and that the range spans from 88.4x (on 21 November 2008 within the Black Swan, Silver diving in industrial metal sympathy) down to 31.7x (on 28 April 2011 within the precious metals' drive to their All-Time Highs, Silver the accelerative leader). More pointedly, gold's dashed regression trendline in the above graphic is rising as measured from a year ago-to-date, whilst that below for Silver is falling in this rare peek at her weekly bars and lackluster parabolic trends. 'Course vs. Gold, upon the next surge in precious metals prices, we'll see Sister Silver again as the Ferrari, far out-pacing the bus:
Meanwhile, pacing along at a rather sideways gait is our Economic Barometer, incoming metrics on balance mitigating one another, over which our friend mulls in the below graphic. Yet in the midst of it all came a pronouncement this past week that "for the first time ever" there is "a job opening for every unemployed worker": bit of an oxymoron those last two words, let alone how 'twas moronically determined that one-opening-per-able-person has never been realized. Head-spinning stuff as the Baro stumbles along:
We were informed as well this past week that "the stock market has its swagger back". We shan't dare mention its dagger, (i.e. the various "true" measures of the S&P 500's price/earnings ratio). Why wreck the fun, eh? Still, a noted FinAnalyst queried this past week that: should earnings slow, what else could push stocks higher? We in turn query, why do they have to go higher? The 25% correction continues.
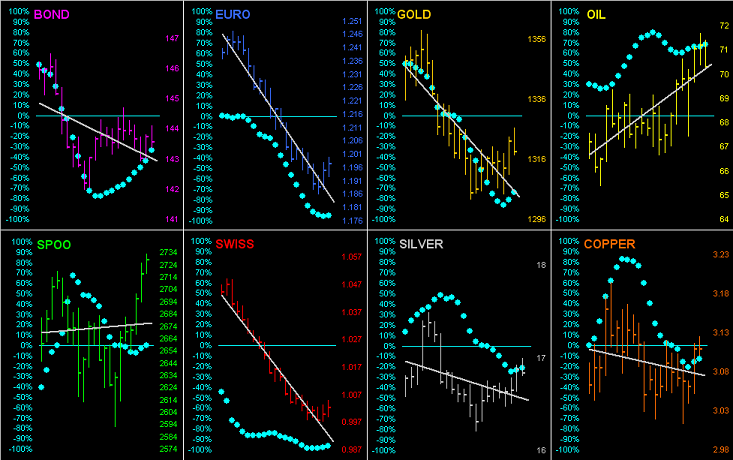
Turning next to our popular "Baby Blues" which denote linear regression trend consistency, this time we go 'round the horn with the daily bars from a month ago-to-date for all eight components of the BEGOS Markets: and therein we do find gold positives. For example: the Bond (upper left) sees its blue dots on the rise, indicative of price having halted its decline, long-end rates reaching a stop sign. The Euro and Swiss Franc (column left of center) find their Baby Blues having bottomed such as to begin curling up, which bodes well for higher levels and Dollar weakening. The precious metals (column right of center) find the blue dots for Gold with a classically positive upturn that can make for a more happy May, although Silver remains in industrial metal mode as her chart looks practically identical to that for Copper (lower right). Big Oil (upper right) obviously has been the strongest of the bunch; but then look at the S&P 500 ("SPOO", lower left), its "Baby Blues" quite unsupportive of price's recent spike, (say no more):
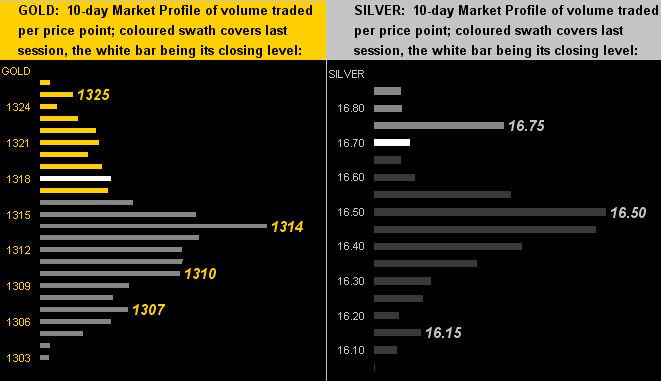
As for the 10-day Market Profiles of the precious metals, we see gold (below left) with some degree of cushion created in the 1314-1310 zone, and likewise for Sister Silver (below right) sub-the mid-16s. 'Course, rarely these days does she ever actually depart the 16s:
So for gold, here's how it presently stacks up:
The Gold Stack
Gold's Value per Dollar Debasement, (from our opening "Scoreboard"): 2785
Gold’s All-Time High: 1923 (06 September 2011)
The Gateway to 2000: 1900+
Gold’s All-Time Closing High: 1900 (22 August 2011)
The Final Frontier: 1800-1900
The Northern Front: 1750-1800
On Maneuvers: 1579-1750
The Floor: 1466-1579
Le Sous-sol: Sub-1466
Base Camp: 1377
2018's High: 1369 (11 April)
The Weekly Parabolic Price to flip Long: 1368
10-Session directional range: up to 1326 (from 1302) = +24 points or +1.8%
Trading Resistance: 1325
Gold Currently: 1318, (expected daily trading range ["EDTR"]: 12 points)
10-Session “volume-weighted” average price magnet: 1317
Trading Support: 1314 / 1310 / 1307
2018's Low: 1302 (01 May)
Neverland: The Whiny 1290s
The 300-Day Moving Average: 1288 and rising
The Box: 1280-1240
Finally, we've this from the "What's The World Coming To? Dept.":
'Tis "Blockchain Week" in New York. The abstract subject remains something with which yours truly comprehensively struggles. Even when, some months back, Bloomy published a sort of "blockchain for dummies" in five steps, we got lost on the second. Then as you know, in our beloved Monaco, they're coming up with the "Monoeci", which frankly sounds rather yecky ... but we're trying to learn in a strained attempt to keep abreast of things. For after all, with respect to this week's New York blockchain affair, 'tis featuring St. Louis Federal Reserve Bank President James Bullard's being promoted as one of the "biggest movers and shakers in the crypto world" ... REALLY? We're talking "The Fed" here, folks, (Dr. Bullard himself being an alternate voting member of the Federal Open Market Committee). Blockchain, bits**t, don't understand it! We'll cast our vote for gold!

Mark Mead Baillie has had an extensive business career beginning in banking and financial services for two years with Banque Nationale de Paris to corporate research for three years at Barclays Bank and then for six years as an analyst and corporate lender with Société Générale.
For the last 22 years he has expanded his financial expertise by creating his own financial services company, de Meadville International, which comprehensively follows his BEGOS complex of markets (Bond/Euro/Gold/Oil/S&P) and the trading of the futures therein. He is recognized within the financial community of demonstrating creative technical skills that surpass industry standards toward making highly informed market assessments and his work is featured in Merrill Lynch Wealth Management client presentations. He has adapted such skills into becoming the popular author each week of the prolific “The Gold Update” and is known in the financial website community as “mmb” and “deMeadville”.
Mr. Baillie holds a BS in Business from the University of Southern California and an MBA in Finance from Golden Gate University.


