Gold Price…Dark Before The Dawn
 share
share
 share
share
 share
share
 share
share
 share
share
Gold prices have fallen hard since April – under $1,200 as of September 5. When people are depressed about their investments, such as now with gold, it is wise to remember that everything changes, and highs follow lows which follow highs.
-
The S&P500 Index fell from 1,500 to 666 fifteen months later in 2008 – 2009.
-
Crude oil rose to $147 and fell below $36 in 2008.
-
Silver rose from $4.01 in 2001 to over $48 in 2011 and fell under $14 in 2015.
Gold prices are low in 2018, oversold and will rise. When? Someday soon, but when, like market crashes, is unknown.
But in the long-term…
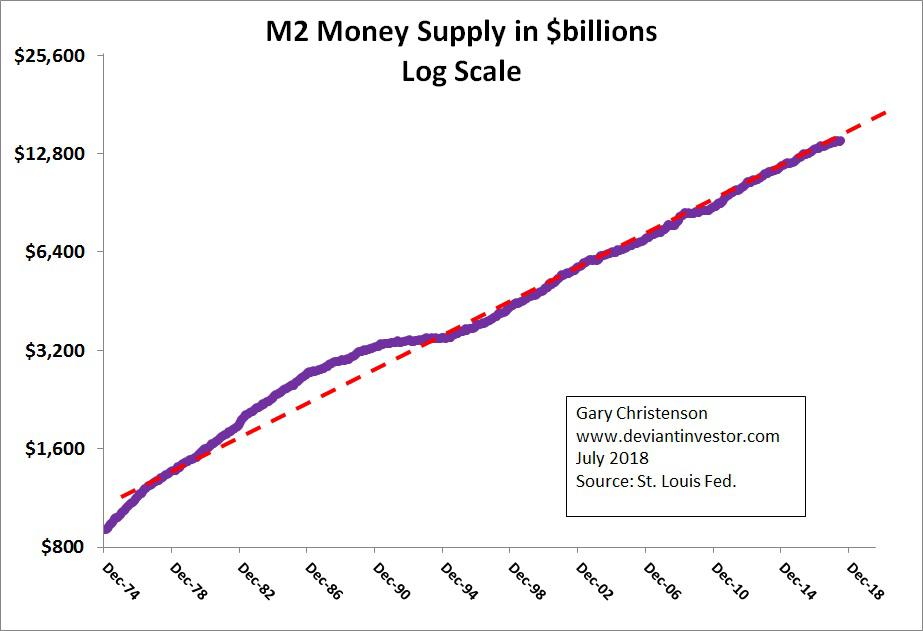
M2 is a measure of currency in circulation reported by the St. Louis Fed. I graphed their data on a log scale. The upward sloping line shows an exponential increase from $900 billion in 1974 to over $14,000 billion in 2018.
Conclusion: M2 has risen exponentially for decades and will rise further, regardless of which “party” claims they control the government, central bankers “printing” dollars or commercial bankers expanding the supply of dollars and devaluing them.
Many people have observed that commodity prices and stock prices move in opposite directions. When gold prices are low (like now) stock prices are likely to be high. On average they offset each other, which means the sum of the S&P 500 Index plus gold prices should smooth volatility and show long-term trends.
The following graph shows the sum of gold times 1.33 plus the S&P 500 Index. The 1.33 factor is the average ratio of the S&P to gold over 33 years, so they are weighted equally.

The sum of gold (times 1.33) plus the S&P is relatively stable as it exponentially increased over 33 years.
Conclusion: As M2 increases, the extra dollars in circulation are fed into both stocks and gold and cause their sum to exponentially increase.
M2 will increase as long as bankers expand dollars in circulation, as long as politicians accept contributions, as long as Wall Street wants your dollars, as long as…
M2 will exponentially increase and so will the sum of gold plus the S&P.
Questions: Are gold prices low compared to the S&P? Are gold prices more likely to drop to half their current value or double from here?
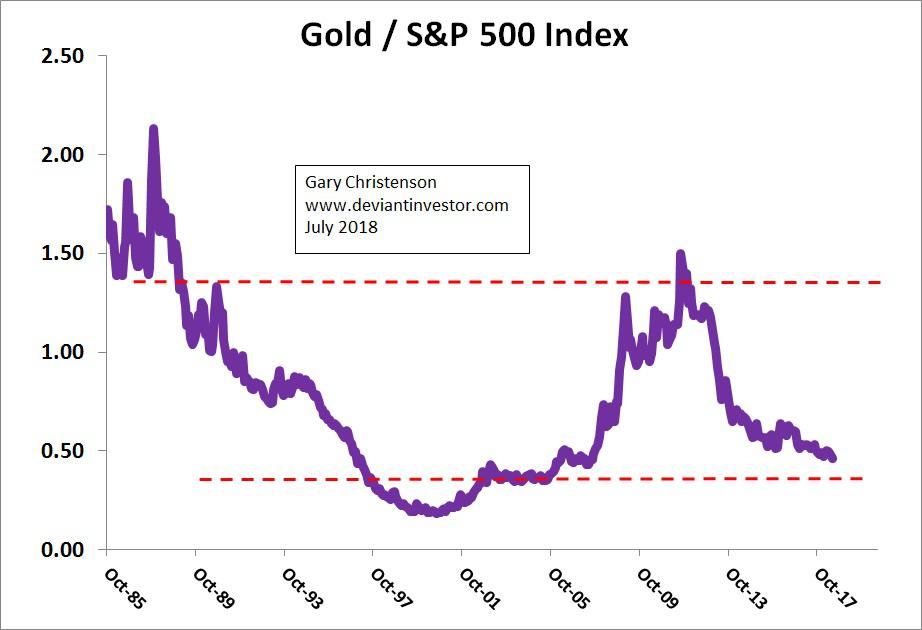
Answer: The graph of gold divided by the S&P 500 Index shows that gold is low compared to the S&P. The average ratio for 33 years – since 1985 after the gold bubble of 1980 – has been 0.75. The current ratio is about 0.44. Gold prices could double from here by returning to their 33 year average for the ratio. They could rise much farther if they rose to ratio highs seen in 1980. Even higher prices are likely when central banks flood the economy with more “printed” currency units during the next recession.
Question: You claim M2 increases are reflected in both gold prices and S&P prices, and in their sum. Do they really increase together?
Answer: If increasing currency in circulation (measured by M2) drives rising prices and devalued dollars, the ratio of the sum (gold plus the S&P) divided by M2 should be more or less constant. Graph that weighted sum (gold times 1.33) plus the S&P and divided by M2 (in $billions). The result is shown below.
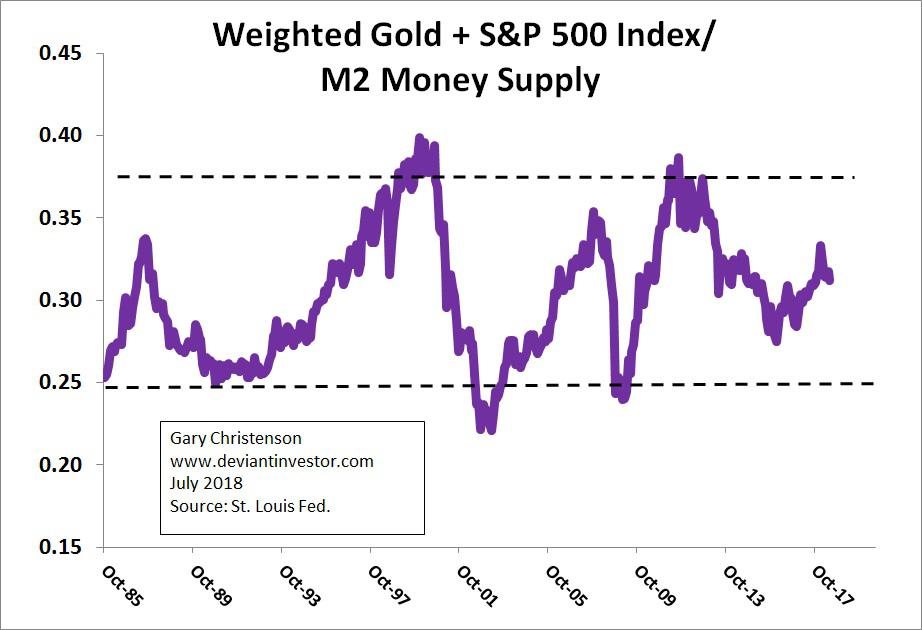
Most monthly ratio data points for the past 33 years have remained in a trend channel between 0.25 and 0.37. The ratio is relatively constant over many decades.
Conclusion: As M2 rises, so does the sum of gold plus the S&P500 Index.
WHAT DOES THIS PROVE?
-
It’s not a mathematical proof. It is graphical evidence of exponentially rising quantity of currency in circulation over many decades.
-
It shows that M2 is consistently rising and the sum of gold plus the S&P rise similarly, although the S&P is sometimes weaker or stronger than gold.
-
It is graphical evidence that gold prices are low in 2018 compared to the S&P 500 Index.
-
It shows that our current financial system needs a rising M2 to create dollar devaluation, rising consumer prices and increasing prices for stocks and gold.
Item August 1971 July 2018
M2 $ 689 billion $14,100 billion
Gold $42 $1,250
S&P 500 99 2,810
CONCLUSIONS
-
Decades of financial history show that M2 increases exponentially. The increasing M2 benefits bankers and politicians, so it will continue.
-
Decades of financial history show that the sum of gold and S&P prices rise along with M2.
-
Gold prices are low today compared to the S&P 500 and total debt (not shown in this article). See here.
-
Neither politicians nor bankers want changes. But unless the financial system changes, expect rising M2 and increasing gold prices.
-
Decades of financial history show that gold prices are low in 2018 compared to the S&P 500. Expect gold to rise and the S&P to fall for several years.
-
Gold prices probably will be several (many) times higher in a few years.
Take advantage of inexpensive gold prices. China, Russia and India appreciate gold’s value. It appears that Americans are more interested in credit and debt, which will not end well.
Miles Franklin has no influence on M2 but they do sell gold.
1-800-822-8080.
The Deviant Investor
share
share
share
share
share
 Gary Christenson is the owner and writer for the popular and contrarian investment site Deviant Investor and the author of the book, “Gold Value and Gold Prices 1971 – 2021.” He is a retired accountant and business manager with 30 years of experience studying markets, investing, and trading. He writes about investing, gold, silver, the economy and central banking.