Gold Price 2021 Forecast: Continuation Advance Ahead


As precious metals investors, it can sometimes be difficult to tell whether major world events are positive or negative for the prices of gold and silver.
However, a repeating pattern is now playing out in the gold market – a pattern which also appeared once before, nearly 10 years ago – which suggests that recent world events will be highly supportive for gold prices in the future.
Let us examine these world events and then turn to our expectations for gold prices in 2021 and beyond.
World Events – Bullish or Bearish for Gold?
Are escalating Coronavirus cases negative for gold prices, since business shutdowns are deflationary and hence cause a boost for the value of the US dollar?
Or are escalating Coronavirus cases positive for gold, since they eventually mean more government stimulus and bailouts, which are in turn negative for the value of the US currency?
Is President Trump’s expected departure from office next month good for silver prices or bad for silver prices?
How are we to know?
Amidst the intensity of world events as of late, there is one way in which we can cut through the noise and identify what is really happening in the world, and how it should impact our decisions as investors. And that is: to focus on price.
Price Contains All Knowledge
After all, price contains the sum of all participants’ knowledge in a market. Buyers, sellers, investors, traders, pumpers, short-sellers, manipulators, hedge funds, banks, sovereign wealth funds, and central banks must all come together at one single point in the market: the current price.
Price contains the sum of all knowledge regarding the market at a given moment. By studying price, and trends in price, we can discover what a market is really expecting, despite the cross currents in world events.
Gold Price: Retest Successful
Let us turn to the gold price. Below we show gold from 2001 through the present:
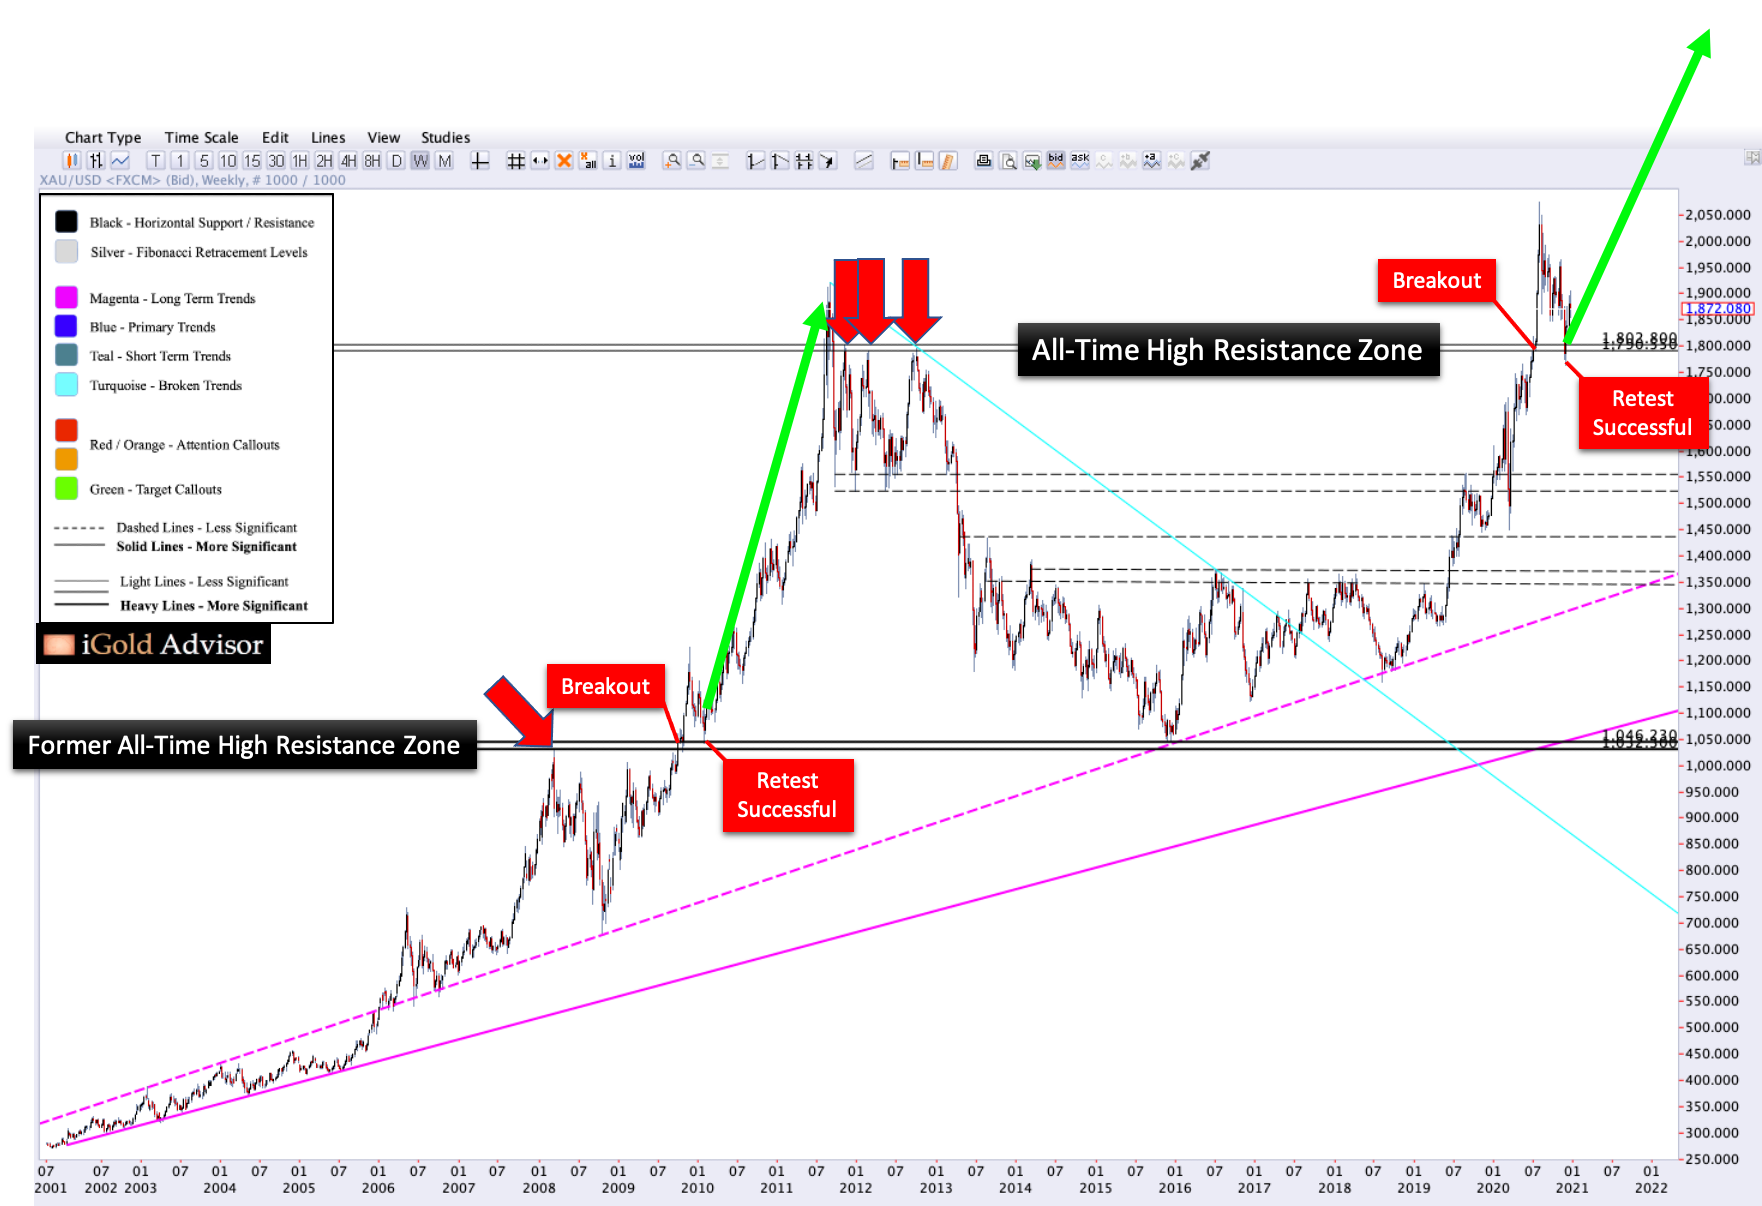
- Gold made an all-time high in September, 2011 at $1,920 per ounce in the spot market.
- However, after that peak, on three subsequent attempts through 2012 to advance back above that figure, gold was stopped in its tracks right at $1,800 per ounce (three red arrows).
- Thus, it is not accurate to say that $1,920 was gold’s true resistance zone. Instead, $1,800 was the all-time high resistance zone dating back to 2011 (black).
- In July of 2020, after nine years of consolidation, gold finally broke higher through this all-time high resistance zone (red callout). Gold then surged to $2,074 in August, only to enter a five-month decline, which continues presently.
- This five-month decline represents a retest of the former all-time high resistance zone at $1,800 (black). Note how gold retreated almost perfectly to the former resistance zone, only to rebound back up over $100 toward $1,900 currently.
- What this means is that gold’s retest has been successful.
- After a successful retest, we expect a significant continuation advance to develop for the gold market, which should target $2,794 at minimum over the next 1 – 3 years. This target is derived from a measurement of the amplitude of the 2011 – 2020 consolidation ($874) added onto the former all-time high of $1,920.
In sum, this is a critical time for gold investors to be making their final purchases before a significant continuation advance is ready to unfold lasting through 2021 - 2023.
The Pattern in the Past
Unfortunately, many gold investors have become disillusioned over the last several months of the decline. Even more unfortunate is that right now is exactly the wrong time to not be paying attention.
Those who fail to learn from the past are doomed to repeat it.
The breakout retest continuation advance pattern that gold is currently within was last witnessed nearly 10 years ago. It should serve as a lesson for investors now:
- Gold peaked at $1,033 in March, 2008 during the midst of the Lehman Brothers and subprime crisis.
- Gold then declined and consolidated for 18 months through September, 2009.
- Gold finally broke out above the former $1,033 peak in September, 2009, as India bought 400 tonnes of gold from the IMF.
- Following the breakout, gold advanced up to $1,227 by November, 2009.
- Gold then retreated to retest the breakout point, declining back to $1,045 in January, 2010.
- Following the successful retest, gold advanced for $875 over nearly two more years, up to the $1,920 peak in 2011.
This entire breakout à retest à continuation advance cycle is illustrated on the left side of the chart above.
Takeaway on Gold Prices
After a break of an all-time high, the gold market will typically come back to retest its former resistance zone.
Following a successful retest, a major continuation advance is expected.
Gold has now just successfully retested its former 2011 all-time high resistance zone.
A continuation advance up to $2,794 is expected to commence shortly and last for several years.
This pattern has played out in the gold market many times before, the last time being 2008 – 2011.
Price patterns are a reflection of human nature, which does not change throughout time.
This price pattern is materializing again, now.
At www.iGoldAdvisor.com we are now preparing private investment clients and research subscribers for the move ahead in gold, silver, and mining stocks.
Although it can sometimes be difficult to decipher whether world events are positive or negative for precious metals prices, by studying the language of the market itself through price analysis we can position ourselves for significant profit ahead of time.

Christopher Aaron began his career as an intelligence analyst for the CIA and Department of Defense. He served two tours to Afghanistan and Iraq between 2006 - 2009, conducting pattern-of-life mapping for military leaders.
Mapping shares similarities with technical analysis of the financial markets because both involve the interpretation of repeating patterns found in human nature. He is the founder of iGold Advisor, providing independent research and analytics on all aspects of the precious metals markets.
He speaks regularly on the cyclical patterns found within the financial markets and on international policy. He has been featured in the New York Times and NPR news amongst other financial publications.


