Gold Price Can’t Go Down Forever


Well, gold has almost reached my $1100 projected mark, so what’s next? Looking at my long-term point and figure (P&F) chart it looks like the $900 mark is next in line. At the Friday close gold futures were in a free fall, well not really free as someone is paying for it. There is nothing interesting in the long, intermediate or short-term perspective for gold…it’s all down.
Instead of talking about the trend and momentum of the gold price as I usually do I thought that everyone could tell just from the daily chart what is going on. Today I thought I’d just briefly talk about how I come up with my projections for a move in gold. These ARE NOT predictions, but best guess projections using techniques that have stood the test of time and have a reasonable track record. The basic technique is the point and figure (P&F) technique. I started researching technical techniques way back in the mid-1960s. As far as the P&F technique was concerned I have probably read most books on this technique, at least up to the early 1980s. After that, I knew it all…so why bother any further research? I have taken a little bit here and a little bit there and developed my own P&F technique. Initially it was developed to address the Canadian “penny” stocks, which the P&F of the day did not adequately address. A little massage here and a little there and I was able to apply the technique to most stocks and Indices.
By changing the criteria applied to the P&F chart one can come up with short-term charts or any term charts. Today, let’s just look at my long-term P&F chart for gold. To see an intermediate term P&F chart for gold check out my commentary for 12 July 2016 in the archives. There you will see that not everything is perfect.
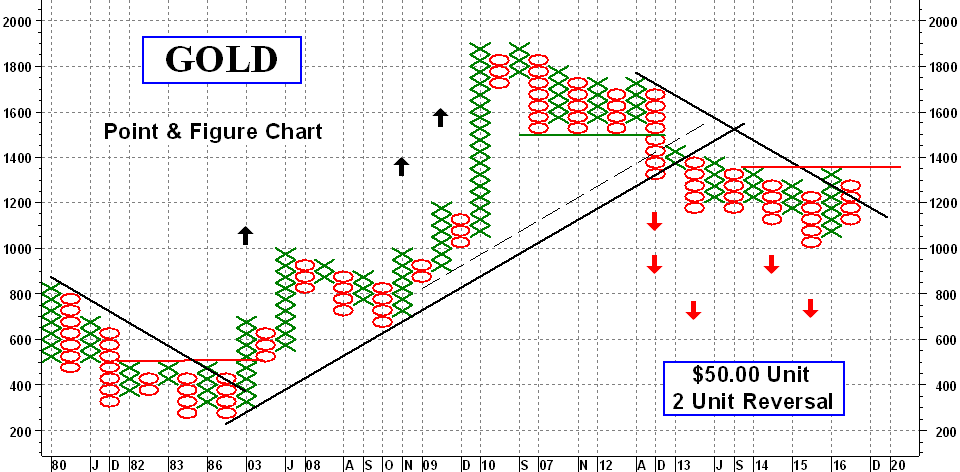
LONG TERM P&F GOLD CHART
For those unfamiliar with P&F charts, most are made up off Xs going up and Os going down called units. Units have a very specific price. For this long term-gold chart the units are assigned a price of $50.00 (not $49.99 or $50.01). To change the direction of a plot, say from up (Xs) to down (Os) you must be able to plot a minimum of the unit reversal criteria number of units. In this case the unit reversal chosen was 2 unit reversal. So, if the last plot was an X at $1000 and the action reversed to the down side you must be able to plot at least 2 Os before plotting anything, i.e. the price must have dropped to AT LEAST the $900 level to plot the 2 Os. Otherwise you plot nothing or continue to the up side with further Xs. There, the plotting technique in a nutshell.
One other aspect to the plotting is that of the trend lines. I use primarily the 45 degree lines, up or down. As long as the units themselves are a perfect square, i.e. the width and depth of the units are identical we have a perfect square and use a true 45 degree line. Often, for appearance sake we skew the chart making the width and depth different scale. When we do that the slope of the trend line changes to accommodate the skew.
When do I call a long-term bull or bear market? Using the P&F chart only, the following criteria is used. For a new bull market the Xs must have moved above the primary down trend line AND above two previous Xs. The reverse is true for a bear market. How has this worked?
The recent bull market started when gold moved to the $550 mark. At the $1300 mark it gave us a bear signal. However, it did break on the downside earlier, at the $1500 level but did not, at that point, break below the primary up trend line. When a significant break occurs far from the trend line one uses judgement but would watch that $1300 mark in any case. We remain in that long term bear market.
One thing you might have noticed, as a long term analysis the P&F signals occur late in the trend. Still, one would be in the major moves following these signals. I prefer the intermediate term signals as far closer to the actual breaks.
On the chart you see the various up arrows and down arrows. These are P&F projections taken at different times during the move. I wouldn’t go into how these are calculated at this time, maybe sometime later. Just one point about the projections. My experience with projections has been that they are very accurate on the first projection after a reversal of trend, with about an 80% accuracy. However, as the trend progresses and new projections can be calculated, these have lower and lower probabilities of accuracy.
At the present time we have two projected targets to go. The next is at the $900 level and then the $700 level. Remember, the follow-on projections have lower and lower probability.
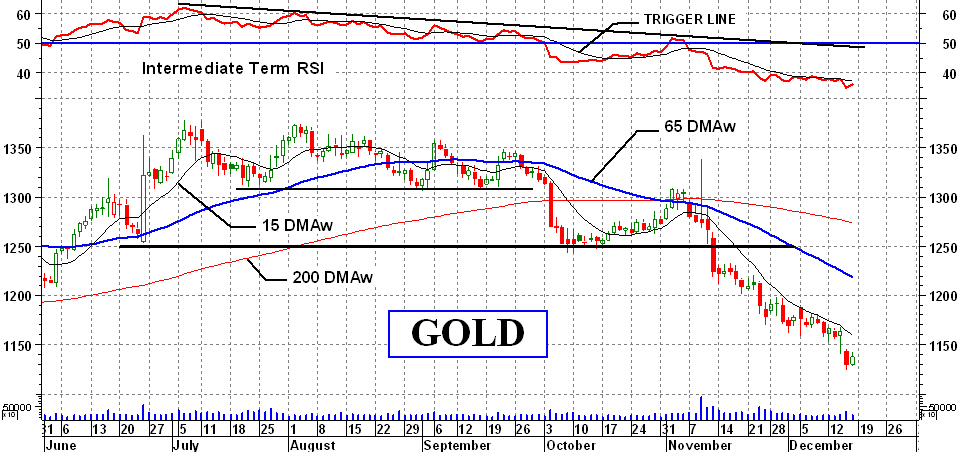
Gold Short-Term
About the only encouragement in the charts is the short-term momentum indicator. It is in an oversold zone ready to reverse and move higher. We have a short-term positive divergence in this indicator suggesting a possible upward move in the price starting around now. How far it will go is unknown at this time.
Back to my normal commentary next time.
To all who are celebrating this Christmas season, a very Merry Christmas to all and to your families.
********
Readers are invited to view my Facebook page at https://facebook.com/merv.burak where I will be slowly posting commentaries explaining in more detail my various indicators and techniques. I also present from time to time some individual stocks that look as if they may be good speculations. However, nothing I post is meant to be a recommendation to buy or sell. One should check with their broker or investment advisor before acting.
 Merv is a retired Aerospace Engineering consultant. He is also a retired market technician with over 40 years of market experience and research. Merv received his certification as a Chartered Market Technician (CMT) in 1992. Developer of many technical techniques and programs which he has been using in his previous Technically Speaking with Wil-Arm and Technically Precious with Merv commentaries posted throughout the globe. Developer of several gold and silver Indices, Merv continues to update his Merv’s Gold & Silver 100 Index and Merv’s Penny Arcade 50 Index and reviews them during his periodic on-going Technically Precious commentaries.


