Gold Price Forecast: Ominous Signal Says Gold Top in 2024
 share
share
 share
share
 share
share
 share
share
 share
share
There is an ominous signal within the precious metals complex which warns that gold may form a significant multi-year top within the next 12 – 18 months. This does not mean one should abandon the sector altogether, as holding some gold is always prudent as an emergency hedge or portfolio insurance. However, the topping signal does suggest that investors should consider ways to mitigate downside risk going forward, as a decline of hundreds of dollars per ounce or more should be in store for mid-decade and beyond.
In the following article, we will discuss the negative signal now appearing and highlight ways to mitigate downside risk as an investor.
The Warning Signal
The most significant warning signal for gold comes via the companies that dig the precious metal out of the ground: gold miners.
Below we show the signal first – discussion will follow:
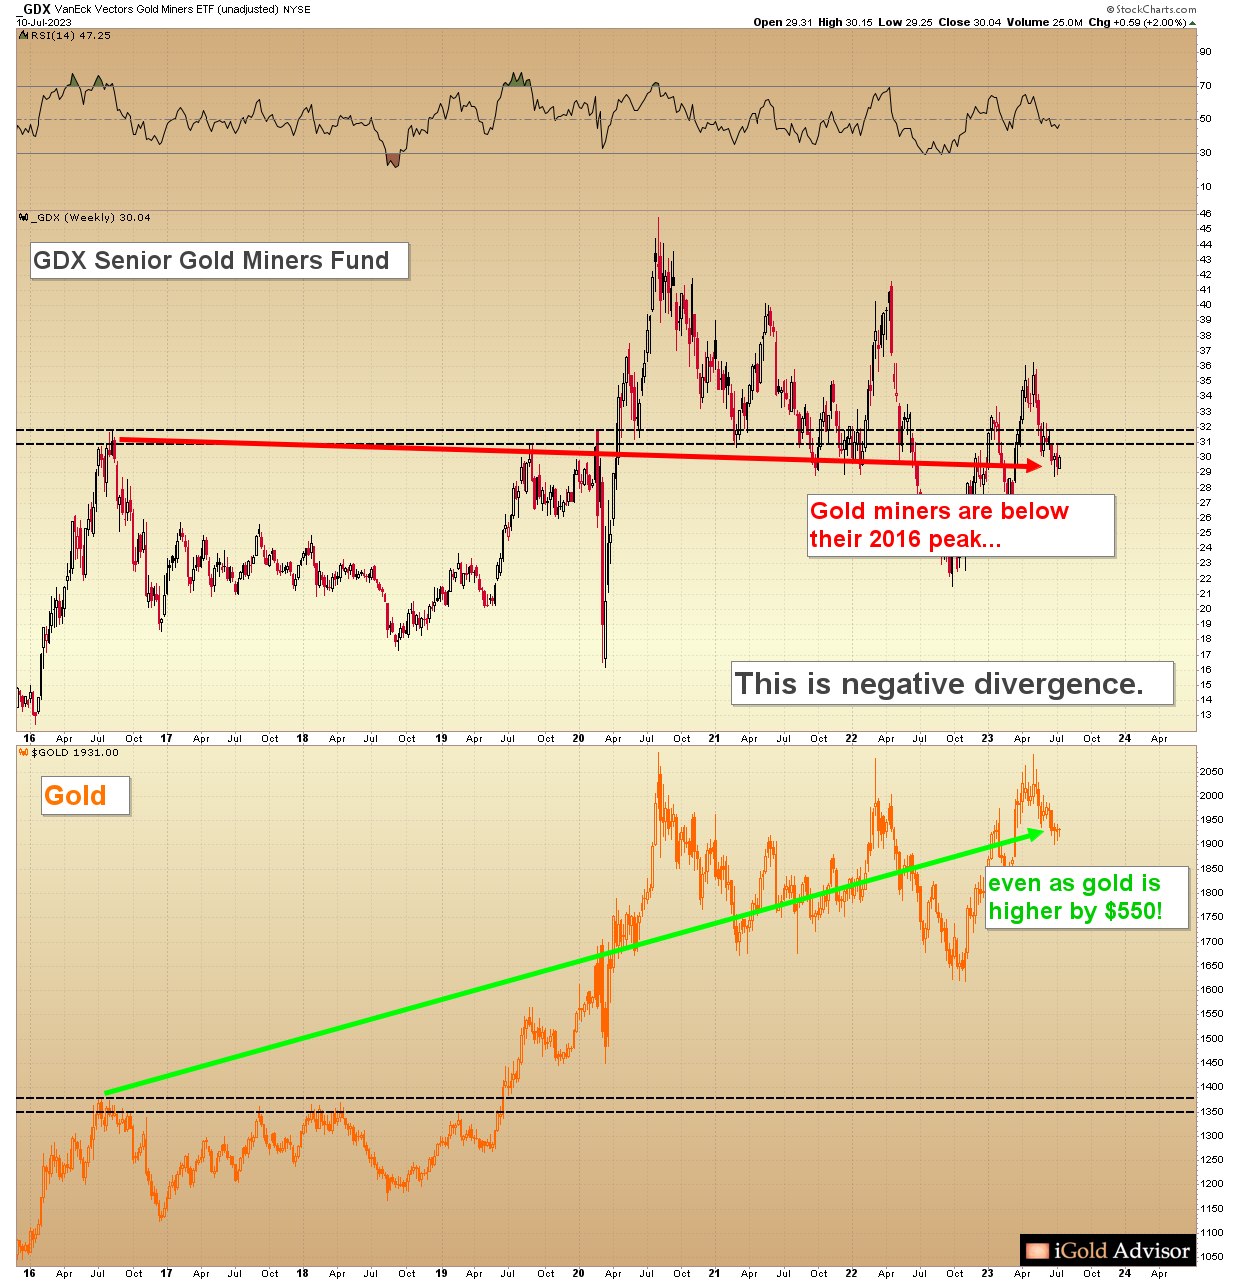
Above we plot the GDX senior gold miners fund on top, with the price of gold immediately below it, dating back to the 2015 bottom at $1,045 per ounce.
Note how both the gold miners and gold surged during 2016, as gold rocketed higher by $300 per ounce to $1,375 by August, and the gold miners nearly tripled off their lows concurrently.
However, something very strange has happened since 2016: while gold is now $550 per ounce above where it was in August 2016, the gold miners are actually trading below their relative 2016 peak. This is called negative divergence, and it should not be ignored.
We can argue endlessly about why the negative divergence signal is so dramatic over the last seven years: higher energy costs, soaring labor costs, and an inability to discover new gold deposits are the oft-cited culprits by many analysts.
However, the key point that most analysts overlook is that the miners are pricing in a pending top in gold itself. In other words, investors in the gold miners do not believe that these current gold prices are here to stay.
Ignore this signal at your own risk.
This Same Signal in 2011
Let us rewind in history to view this same negative divergence signal, the last time that it appeared, in 2011:
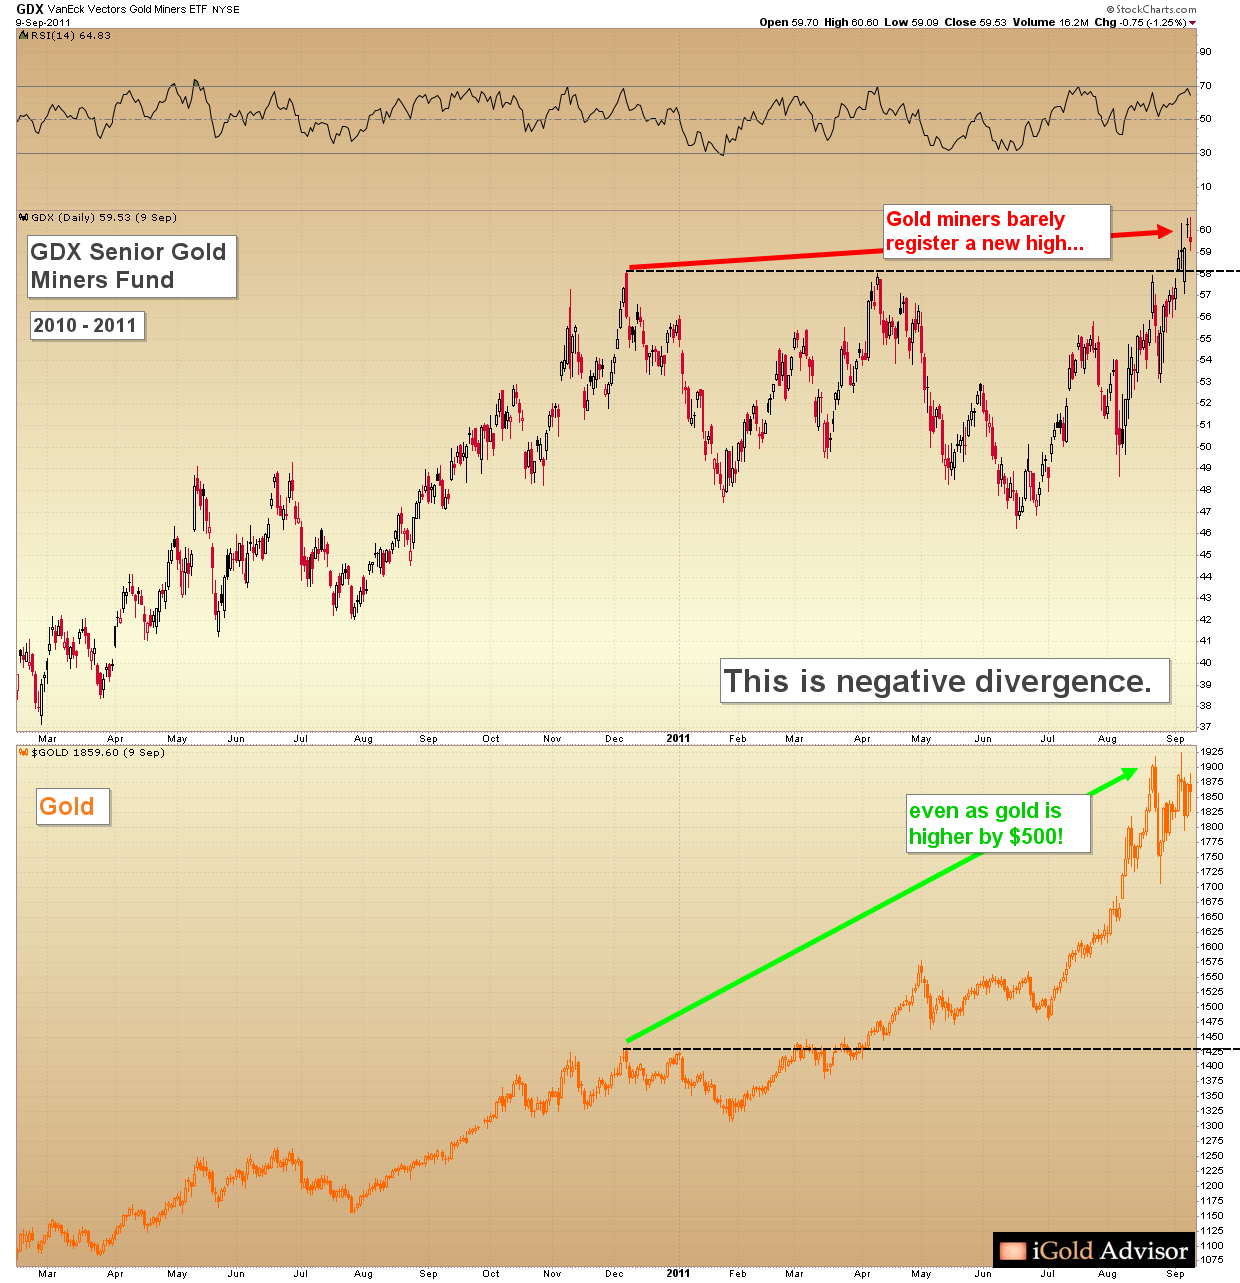
Note how the GDX gold miners peaked at 58 in December 2010, as gold itself formed an intermediate peak at $1,425, following the Global Financial Crisis of 2008 – 2009.
Gold then consolidated for several months, until it began to advance again, reaching $1,575 by April 2011. However, note how the GDX failed to advance during this time, peaking again at the same 58 level which matched $1,425 gold several months earlier.
Gold then continued to surge, reaching its eventual peak of $1,923 per ounce in September 2011. However, the GDX gold miners failed to advance this entire time, only briefly exceeding the 58 figure for a few trading days just as gold was touching $1,900. This is egregious negative divergence by the gold miners!
At the time, many analysts blamed similar factors for the gold miners’ underperformance: rising energy costs, rising labor costs, and of course, manipulation of the market were the most-cited culprits in 2011.
The true reason? Investors in the gold miners were predicting a major top in gold itself.
We can see how serious of a signal this negative divergence was when we fast forward the chart by another five years:
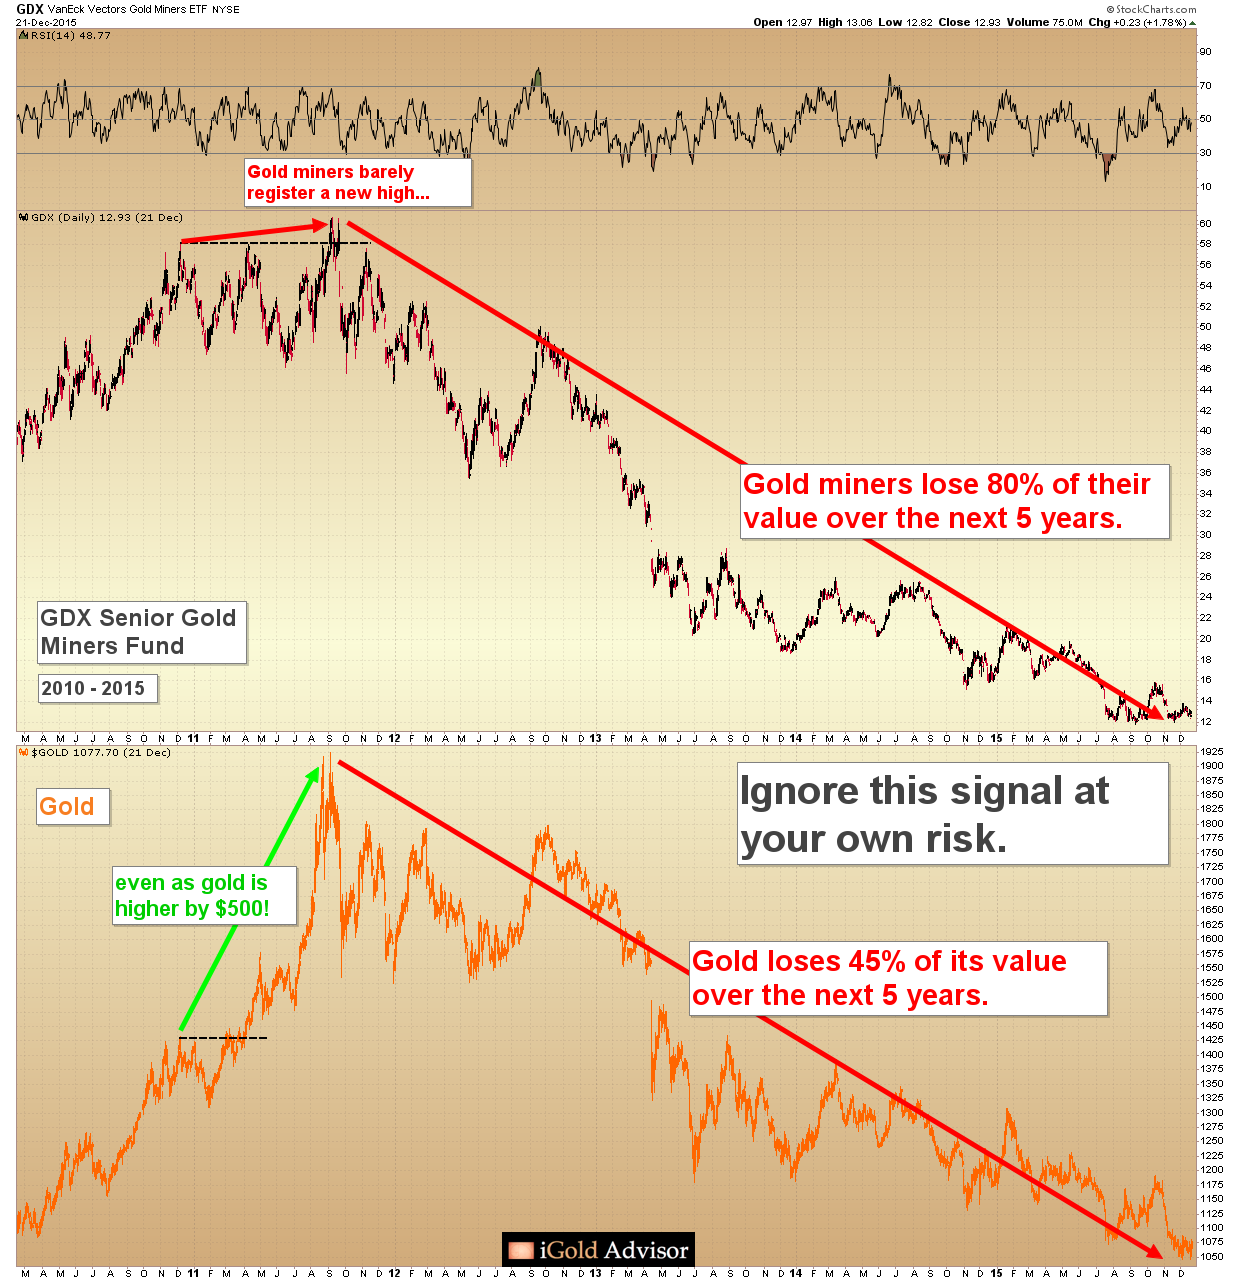
Yes, the negative divergence signal from the gold miners in 2010 – 2011 was a warning signal: gold lost 45% of its value over the next five years, while the senior gold miners lost an astonishing 80%!
The lesson?
This is not a warning signal to ignore, if one care’s about one’s financial health in the precious metals market.
Back to the Present
To re-emphasize the point: the gold miners’ negative divergence signal is now appearing again, just as it did in 2010 - 2011, as gold is again attempting to break to a new all-time high. This is the same signal which appeared in the previous example, except it is even more ominous now, as it has appeared over a 7-year timescale, as opposed to the 2-years it saw back in 2010 - 2011.
But First… One More Advance?
The challenge for gold investors, however, is that when we analyze gold in isolation (without respect to the gold miners), its chart still appears bullish. Gold, it seems, wants to make one more new peak, perhaps to $2,300, $2,500, or even $2,800… before the negative divergence signal takes its grip on the market.
Why does gold itself still appear bullish?
The answer has to do with gold’s chart.
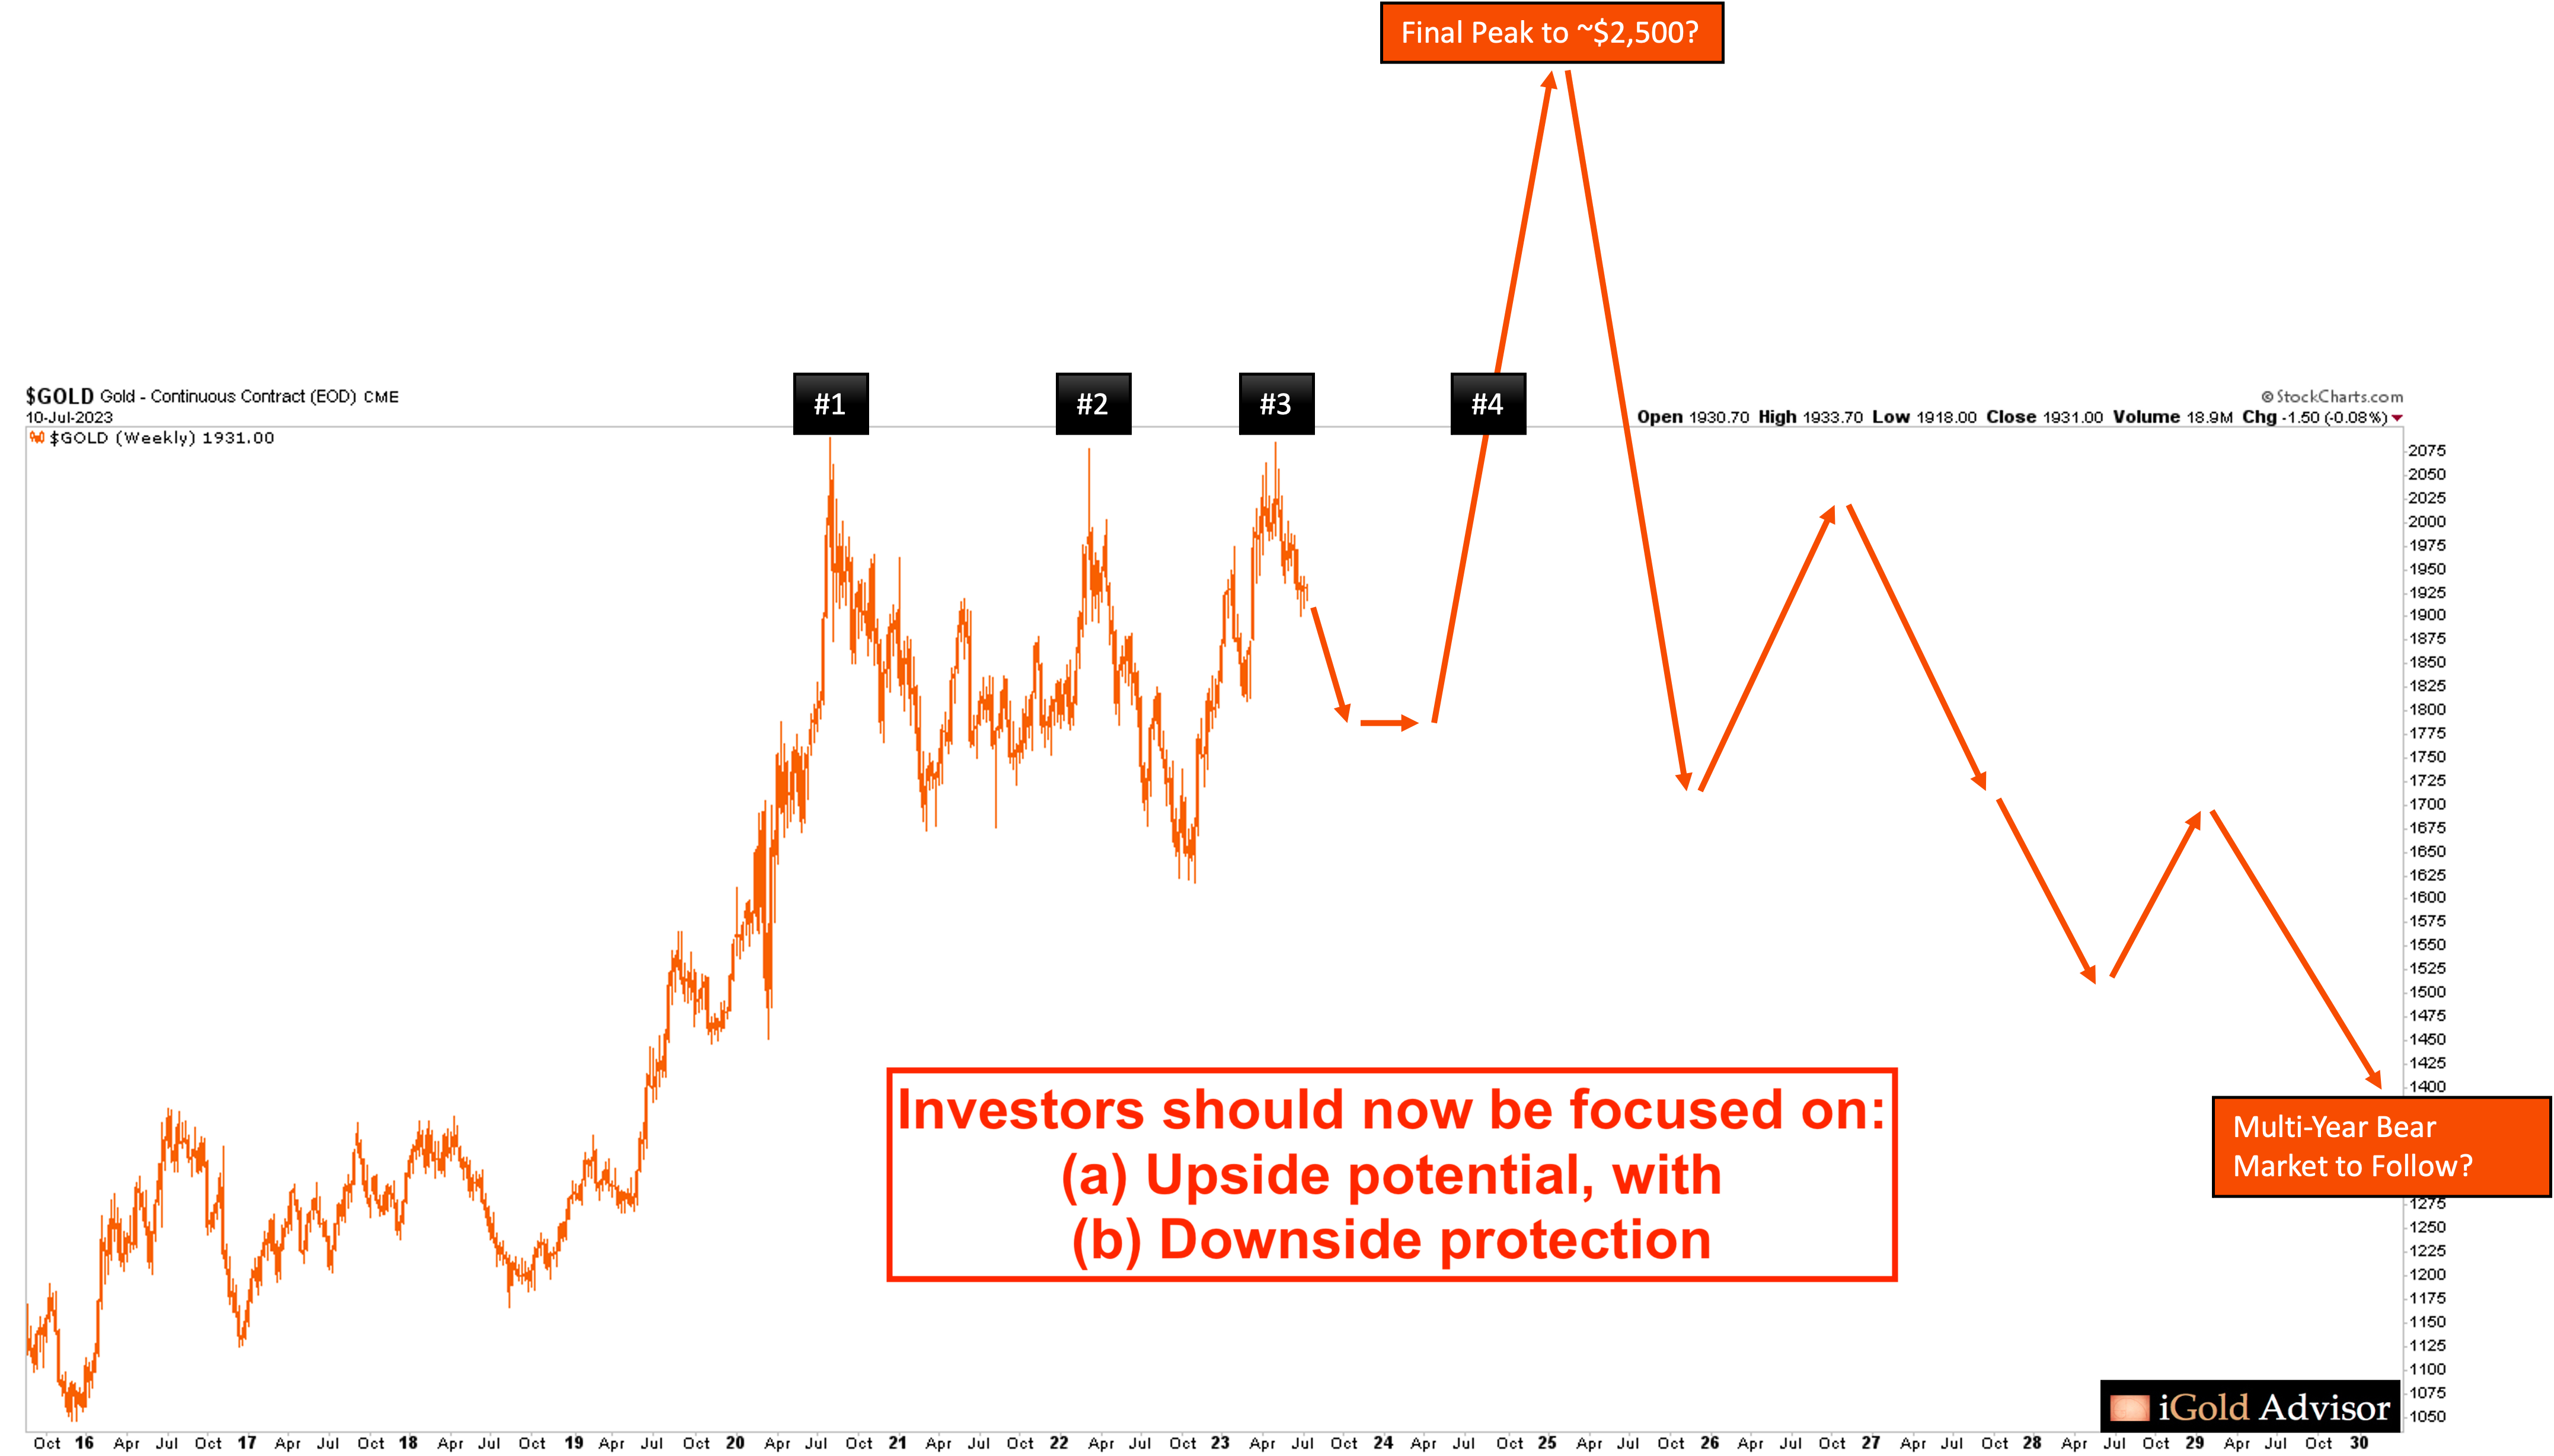
Gold has made three attempts now in three separate years to overcome its $2,075 all-time high set in 2020 (see chart, below).
In financial markets, it is rare to witness an asset form a long-term “triple top.” While we can never state anything as being 100% certain in the markets, long-term triple tops are not typically the manner by which a market will form a final top when studied throughout history.
So if gold’s chart is not yet bearish in isolation, what should we expect going forward?
We expect that gold will indeed break its all-time high $2,075 peak on the 4th (or 5th) attempt, which is due to occur in 2024, and form one new notably higher peak, likely into the mid-$2,000’s range:
Note that many of the gold mining companies could see spectacular rallies during the pending final surge. Especially in the small cap or junior exploration companies, from 100% - 500% gains are typical during final waves higher. Such gains occurred in many companies on the final part of the 2010 – 2011 gold advance, and the final year of the 1970’s bull market.
What could cause this final price spike? It could be a reversal of Federal Reserve interest rate hikes. It could be an escalation of the war between Russia and Ukraine. It could be a “black swan” event that we cannot foresee.
However, we are more concerned with the “what” rather than the “why” of the markets. The markets have a way of speaking the “what” to us ahead of time (if only we listen)… while the “why” gets filled in in retrospect.
Following gold’s last wave higher, a significant multi-year peak should form in the precious metals. The negative divergence which has appeared in the mining sector over the last 7 years should rear its ugly head and cause a top which will last for some years. It is too soon to begin to make downward projections either for price or for time for gold; however, such analysis will be the feature of future articles after we confirm gold’s final wave higher.
Yes, gold appears set for a significant top, which will likely see prices fall by hundreds of dollars per ounce, if not more, over the course of many years. The gold miners will likely not be spared, either.
What is an Investor To do?
Appropriate position sizing for one’s own portfolio will be a key concept to manage the forthcoming decline for gold and precious metals.
Hedging strategies may also be appropriate, depending on the individual’s circumstances.
At www.iGoldAdvisor.com, we specialize in helping individuals to make sure that their portfolios are appropriately sized, based on one’s unique situation, via consultations.
However, there is another precious metals investment, which offers us upside potential in the event of rising gold prices, but which also will pay us back 100% of our principal, should the sector decline.
To educate investors on how this type of gold investment works, we have created a special educational video, which may be watched for FREE on the iGold YouTube channel.
Takeaway on Gold Prices
The senior gold miners are showing an ominous topping signal.
The last time this signal appeared in 2011, gold fell by 45% over the following five years, and the gold miners collapsed by 80%.
This same topping signal is now visible again, suggesting a long-term top may form later this year or in 2024.
However, gold itself still appears poised to make one more final peak, and could surge hundreds of dollars above its 2020 level on the final advance. Many of the gold miners could see spectacular gains during this final wave, even if the sector is eventually going to top.
Investors should now be dual-focused: upside potential with downside protection.
********
share
share
share
share
share

Christopher Aaron began his career as an intelligence analyst for the CIA and Department of Defense. He served two tours to Afghanistan and Iraq between 2006 - 2009, conducting pattern-of-life mapping for military leaders.
Mapping shares similarities with technical analysis of the financial markets because both involve the interpretation of repeating patterns found in human nature. He is the founder of iGold Advisor, providing independent research and analytics on all aspects of the precious metals markets.
He speaks regularly on the cyclical patterns found within the financial markets and on international policy. He has been featured in the New York Times and NPR news amongst other financial publications.
More from Gold-Eagle