Gold Price Update


We’ve all had people come up to us and say “Do you want the good news first or the bad news?” I always opt for the bad news first, to get it out of way and end on a lighter note. The bad news is that the dollar looks set to stage a significant “swansong” rally in coming weeks, which will probably result in gold being beaten down again. The good news is that once that’s done its toast – and that’s when the big gold and silver bullmarket that longer-term charts are calling for will really get underway.
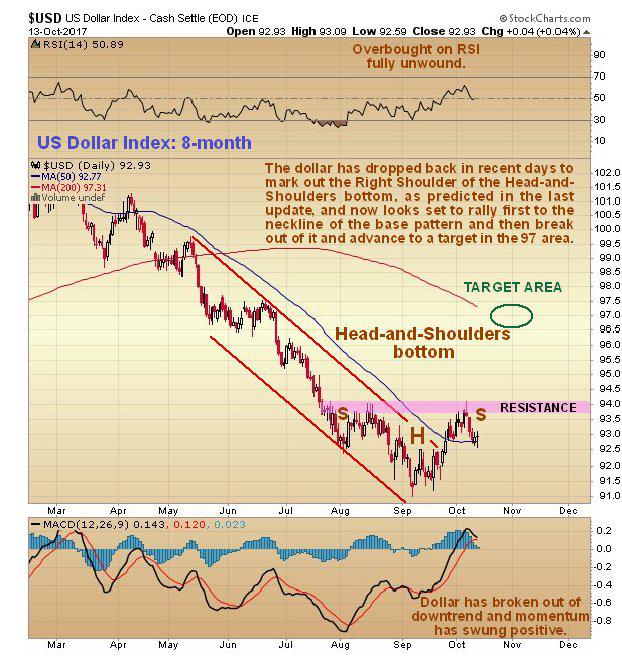
The last update called for the dollar to drop down to mark out the Right Shoulder of a Head-and-Shoulders bottom pattern, and for gold to break out of its rather steep intermediate downtrend and rally, and that is exactly what has since happened. On its latest 8-month chart, we can see how the dollar has backed off to the vicinity of its flattened out 50-day moving average and the vicinity of the Left Shoulder low of the base pattern, in order to mark out the Right Shoulder low. Three bullish developments to be noted that result from the dollar rising out of the Head of the pattern are the breakout from the downtrend, the break clear above the 50-day moving average, and the big improvement in momentum (MACD), which is swinging positive. If our interpretation that this is a genuine Head-and-Shoulders bottom is proven valid, the pattern targets the 97 area in coming weeks, probably by early November. Needless to say, this will not be good news for gold and silver prices.
Our prediction made many weeks ago that the dollar would rally off the lower boundary of its big bullhorn pattern shown on the 4-year chart below to break out above its restraining Dome has proven to be correct, and a projection has been drawn on this chart showing roughly what is expected to happen. As we saw above on the 8-month chart, the base pattern now approaching completion targets the 97 area approx. This is the “swansong rally” – the dollar’s last rally before it “hands in its dinner pail”, and should present a wonderful last opportunity to accumulate the better gold and silver stocks, before the dollar does an about face, and breaks down from the large Broadening Top pattern into a severe decline.

The Hedgers chart has been warning for weeks that the dollar will reverse and rally, as has been pointed out repeatedly. The latest chart shows the rally is still ahead of us – which is congruent with the dollar being at the Right Shoulder low of its Head-and-Shoulders bottom.
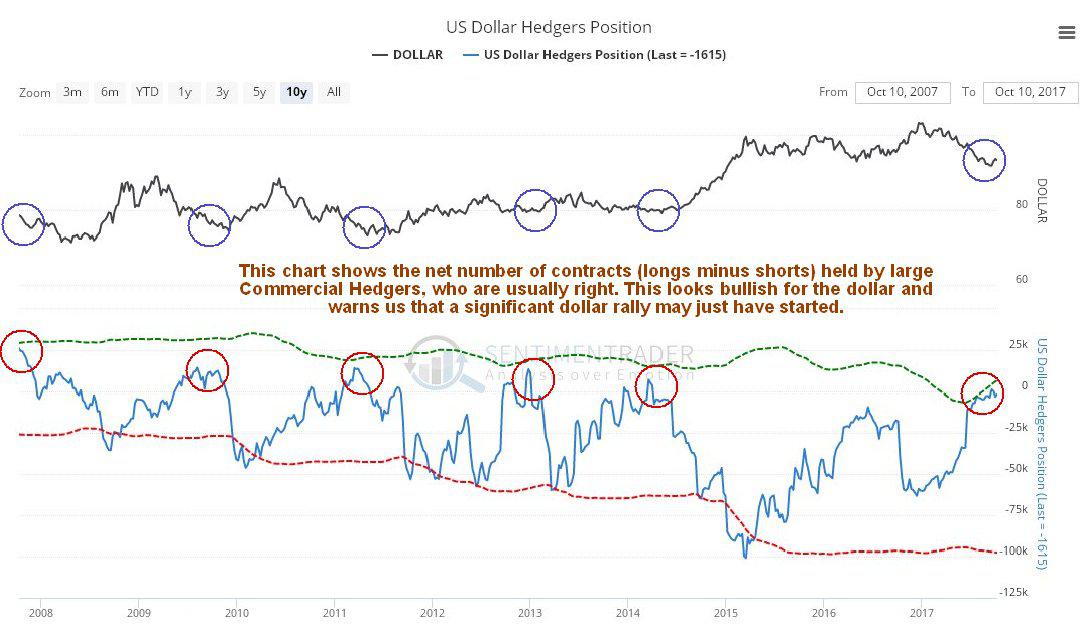
Click on chart to popup a larger clearer version.
Chart courtesy of www.sentimentrader.com
In light of the above it is logical to expect gold’s plucky little breakout from the steep downtrend channel shown on its 6-month chart below to abort, and if the dollar advances towards the 97 area on the index, we would expect gold to react back, probably to the $1200 - $1215 area.

Such a reaction back by gold accords with its latest COT chart, which still looks more bearish than bullish, since gold’s COT structure improved but little on its recent downtrend. There is still a lot of room for improvement on this chart – and that probably means lower gold prices dead ahead…
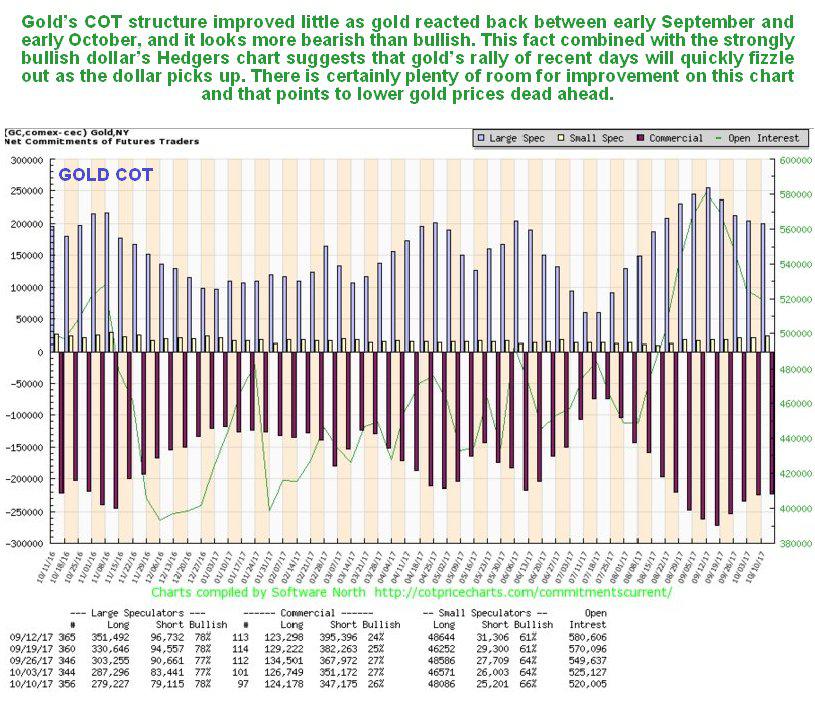
Click on chart to popup a larger clearer version.
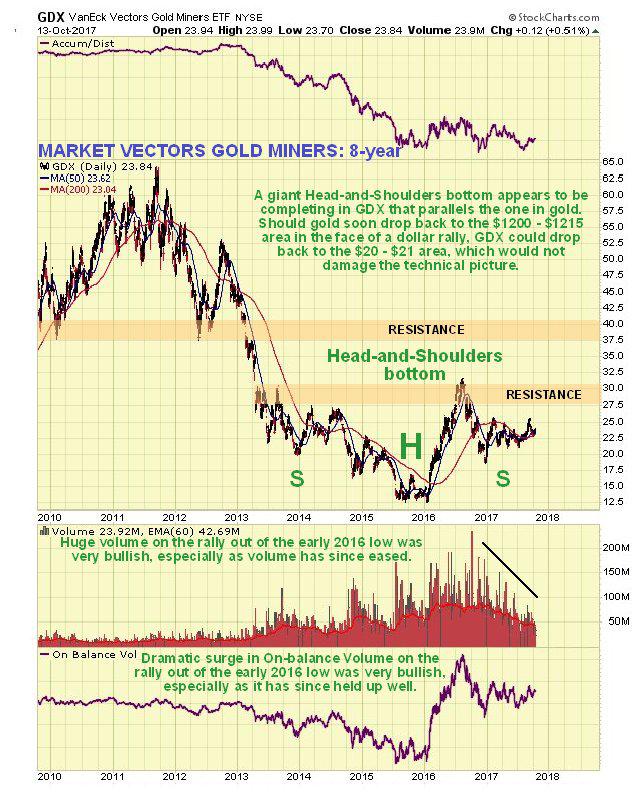
On gold’s 8-year chart it continues to look like it is in the late stages of a giant Head-and-Shoulders bottom pattern. The buildup in volume over the past 20 months certainly looks positive, especially over the past several months, all the more so because it has driven volume indicators higher, notably the Accum-Distrib line, which is not far off making new highs – exceeding its level at the 2011 peak. Once gold breaks above the resistance level approaching $1400 it will be on its way, although it will then have to contend with another important band of resistance in the $1510 - $1560 range. A near-term retreat by gold to the $1200 - $1215 area in the face of a dollar rally will not damage this long-term technical picture.

The Market Vectors Gold Miners, GDX, which functions as a gold stocks index, is marking out a giant Head-and-Shoulders bottom that roughly parallels the one completing in gold itself. A near-term decline to $20 - $21 in GDX will be viewed as presenting another important buying opportunity for the sector. The volume pattern during the build out of this base pattern is very bullish, with big volume on the rise out of the low (Head) of the pattern, tailing off steadily as the Right Shoulder has formed.
A mistake commonly made by gold and silver bugs, especially those close to or involved in the mining industry is to become “wed” to the sector to the exclusion of most everything else. This habit has ruined a good many investors in the Precious Metals sector in recent years. Investing should be regarded as an “opportunity cost game”, where you seek always to maximize your returns within a given timeframe consistent with an acceptable level of risk. This is the philosophy on clivemaund.com which is why we made a detour into the marijuana sector last year ahead of the legalization votes, when it boomed, and why we have invested in a variety of different sectors and stocks this year, notably the Biotech and Medical sector. There is no need to wait around on the Precious Metals sector to start a major uptrend, when, apart from individual outstanding opportunities in the sector than can occur at any time, it is possible to go with whatever is performing in the here and now.
We have had a number of outstanding successes in recent months and weeks where we traded on the basis of some very clear and useful chart patterns and signals, and a number of our stocks have produced some classic examples of chart patterns involving different types of candlesticks and price and volume patterns, often in combination, in the recent past. There is one in particular that I would like to draw your attention to in CHART SCHOOL – Gravestone Doji and Parabolic Blowoff calls a top, where just on the one chart going back 4-months we see a dramatic confluence of different factors – candlesticks, parabolic slingshot, various oscillators and the volume pattern all calling a top RIGHT NOW for a particular stock, and this also provides examples of breakaway gaps and a Flag. We sold this stock on Friday. To take a look at its chart, all you have to do is click on the link above, and for a good measure a couple of other interesting chart examples that we traded are included in this article, which is intended to be educational.
********

Clive P. Maund’s interest in markets started when, as an aimless youth searching for direction in his mid-20’s, he inherited some money. Unfortunately it was not enough to live a utopian lifestyle as a playboy or retire very young. Therefore on the advice of his brother, he bought a load of British Petroleum stock, which promptly went up 20% in the space of a few weeks. Clive sold them at the top…which really fired his imagination. The prospect of being able to buy securities and sell them later at a higher price, and make money for doing little or no work was most attractive – and so the quest began, especially as he had been further stoked up by watching from the sidelines with a mixture of fascination and envy as fortunes were made in the roaring gold and silver bull market of the late 70’s.
Clive furthered his education in Technical Analysis or charting by ordering various good books from the US and by applying what he learned at work on an everyday basis. He also obtained the UK Society of Technical Analysts’ Diploma.
The years following 2005 saw the boom phase of the Gold and Silver bull market, until they peaked in late 2011. While there is ongoing debate about whether that was the final high, it is not believed to be because of the continuing global debasement of fiat currency. The bear market since 2011 is viewed as being very similar to the 2-year reaction in the mid-70’s, which was preceded by a powerful advance and was followed by a gigantic parabolic price ramp. Moreover, Precious Metals should come back into their own when the various asset bubbles elsewhere burst, which looks set to happen anytime soon.
Visit Clive at his website: CliveMaund.com


