Gold Price Update


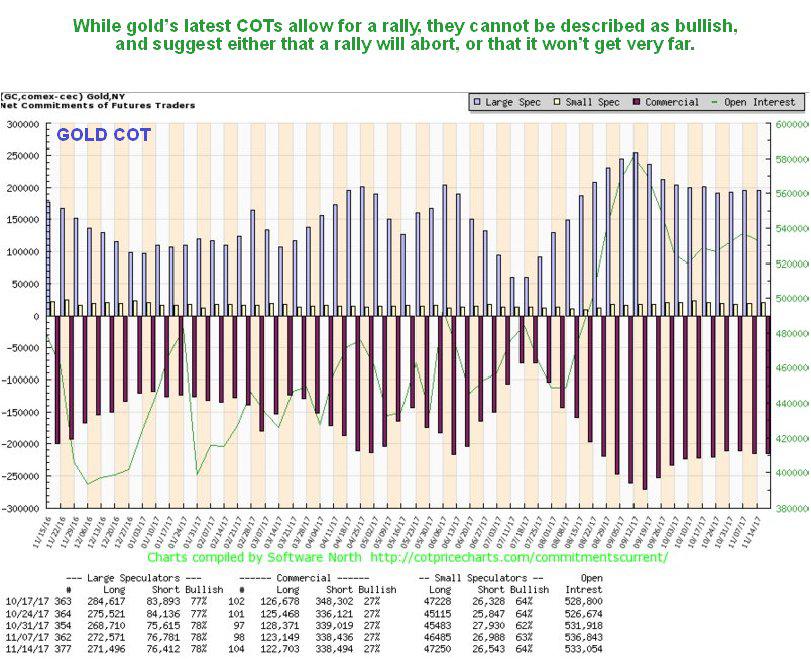
Gold appeared to break out on Friday, but the situation is contradictory because on its price charts it appears to be in position to begin another upleg within an uptrend, but its COTs are still neutral / bearish at best, and don’t appear to allow much room for a rally, while the dollar Hedgers chart is still calling for the dollar to advance, despite its downturn last week.
On gold’s 6-month chart we can see how, after weeks of indecisive sideways movement, it broke sharply higher on Friday, looking like it has aborted the potential Head-and-Shoulders top that we earlier observed. With the rising 200-day moving average having pulled up beneath the price, it is in position for another upleg, especially as the 50-day has dropped back to close up with the price and 200-day, creating a bullish bunching of all three.
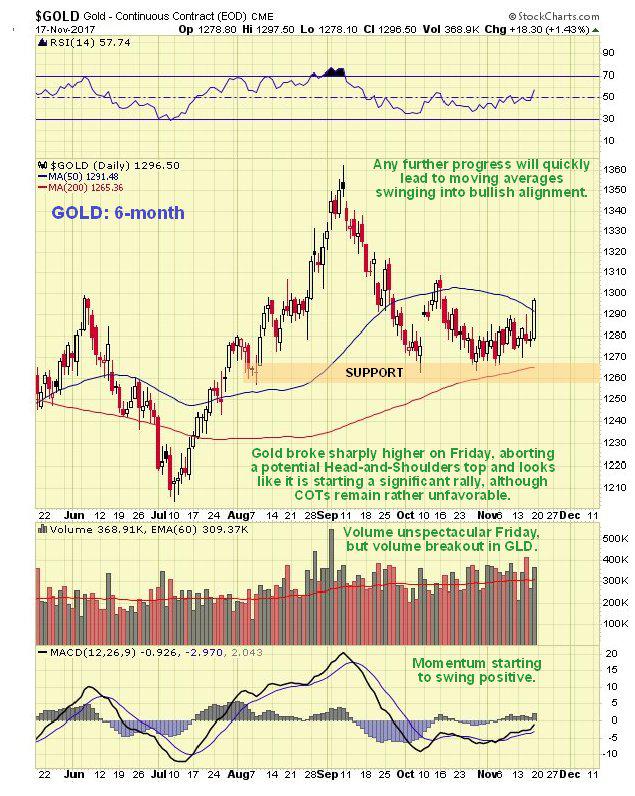
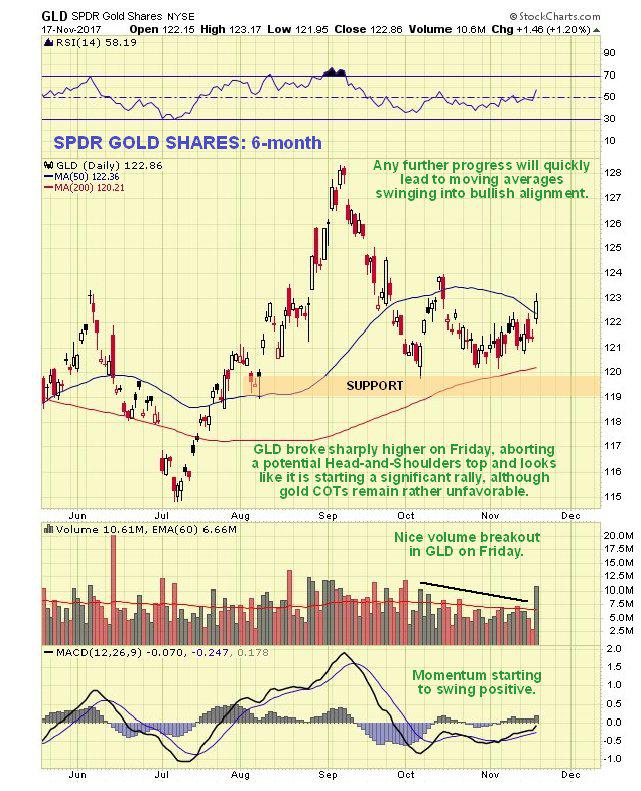
Whilst volume was unimpressive on Friday’s rally in gold, such was not the case with gold proxy GLD, which DID break higher on impressive volume – the highest since early September. This is a positive sign…
The 2-year chart for gold enables us to see clearly what is going on. Friday’s break higher looks like it marks the start of another intermediate uptrend within the now clear channel shown, after the price dropped back to ease its earlier overbought condition and test the support level shown and the support at the lower boundary of the channel. The potential Head-and-Shoulders top that we saw earlier will probably soon be history. There has been a very noticeable build up in upside volume in recent weeks, resulting in strong volume indicators, especially On-balance Volume, which is at new highs. These volume indications certainly augur well for gold in coming weeks.

Against the now positive picture on the gold charts we must weigh the latest gold COT data, which is still neutral / bearish, as normally wrong Large Specs are still holding a big long positions, although they have eased somewhat, allowing room for a rally.
Click on chart to popup a larger clearer version.
We will end now by looking at the dollar and its Hedgers chart. On the 9-month chart for the dollar index we can see the Head-and-Shoulders bottom that it broke out of last month. Following the breakout it has reacted back over the past week or so to the extent that many are now writing it off again. As we can see it is now dug into support near to the upper boundary of the Head-and-Shoulders bottom and is also at support at its rising 50-day moving average, and the big question is whether this support is enough to turn it higher again, especially as its longer-term charts look rather grim. The answer to that is that it probably is, because of the bullish Hedgers positions that we will now look at.
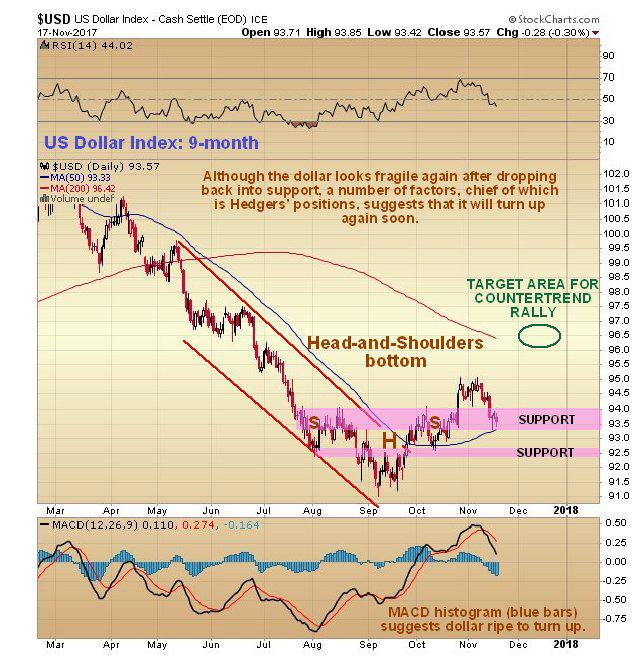
On the latest Hedgers chart we can see that Hedgers’ net positions are now at levels that in the past have always led to a significant rally, and that therefore is what we can reasonably expect to see again. This, needless to say, would complicate the outlook for gold and other commodities (copper’s latest COTs are still quite heavily bearish).

Click on chart to popup a larger clearer version.
Chart courtesy of www.sentimentrader.com
So how do we reconcile the now bullish looking gold charts, especially the 2-year chart, with the still bullish looking dollar index chart, and especially its latest Hedgers’ chart? With difficulty, that’s how. Here we should note that it is possible for the dollar and gold to rally together, although this is a rare event that would involve gold outpacing the dollar, which could happen for example if money flooded out of Europe into the US as a relative safe haven, and also into gold for the same reason. One scenario that is considered quite likely is gold rallying up within its uptrend channel to the band of resistance in the $1360 - $1380 area where a COT extreme develops (which it is not too far off now) before stalling out and dropping again.
An effective strategy for pragmatic traders to play this situation is to be long the Precious Metals sector now, following the buy signal on Friday, and to start taking profits on gold arriving at the resistance level in the $1360 - $1380 area and especially if it should make it all the way to the upper boundary of the channel shown on our 2-year chart. Alternatively, positions should be scaled back if it breaks below the lower boundary of the channel and especially if it breaks below the support level at about $1260.
Finally it is worth pointing out that we are perfectly well aware of the price suppression of gold being undertaken in the paper market as the physical supply continues to tighten, and that the Chinese and Russians are wisely taking the opportunity this presents to vacuum up much of the West’s gold on the cheap, so that later, and quite possibly at a time of their choosing, they will be able to bury the dollar and forcibly put the self-appointed global policeman with its 700-plus military bases around the world “out to grass” as a result of its being economically ground into the dust. At that time, when the Chinese may back the Yuan with gold, gold will reassume its central and traditional role and is likely to soar due to the extremely high level of paper assets relative to gold. A growing awareness of the raw power that China now wields is the reason why the US has suddenly started being nice to China, which has noted and learned the lessons from the US’ treatment of Russia.
*********

Clive P. Maund’s interest in markets started when, as an aimless youth searching for direction in his mid-20’s, he inherited some money. Unfortunately it was not enough to live a utopian lifestyle as a playboy or retire very young. Therefore on the advice of his brother, he bought a load of British Petroleum stock, which promptly went up 20% in the space of a few weeks. Clive sold them at the top…which really fired his imagination. The prospect of being able to buy securities and sell them later at a higher price, and make money for doing little or no work was most attractive – and so the quest began, especially as he had been further stoked up by watching from the sidelines with a mixture of fascination and envy as fortunes were made in the roaring gold and silver bull market of the late 70’s.
Clive furthered his education in Technical Analysis or charting by ordering various good books from the US and by applying what he learned at work on an everyday basis. He also obtained the UK Society of Technical Analysts’ Diploma.
The years following 2005 saw the boom phase of the Gold and Silver bull market, until they peaked in late 2011. While there is ongoing debate about whether that was the final high, it is not believed to be because of the continuing global debasement of fiat currency. The bear market since 2011 is viewed as being very similar to the 2-year reaction in the mid-70’s, which was preceded by a powerful advance and was followed by a gigantic parabolic price ramp. Moreover, Precious Metals should come back into their own when the various asset bubbles elsewhere burst, which looks set to happen anytime soon.
Visit Clive at his website: CliveMaund.com


