Gold Ready For $100 Rally!


We have made no change to our longer term view that wave a of our wave 4 triangle ended at $1130.40 -- and that we are now rallying in our first (a), (b), (c) pattern of wave b. Wave (a) still ended at $1307.80, and within our wave (b) triangle, wave -a- ended at $1141.60 -- and we are now working on wave -b-.
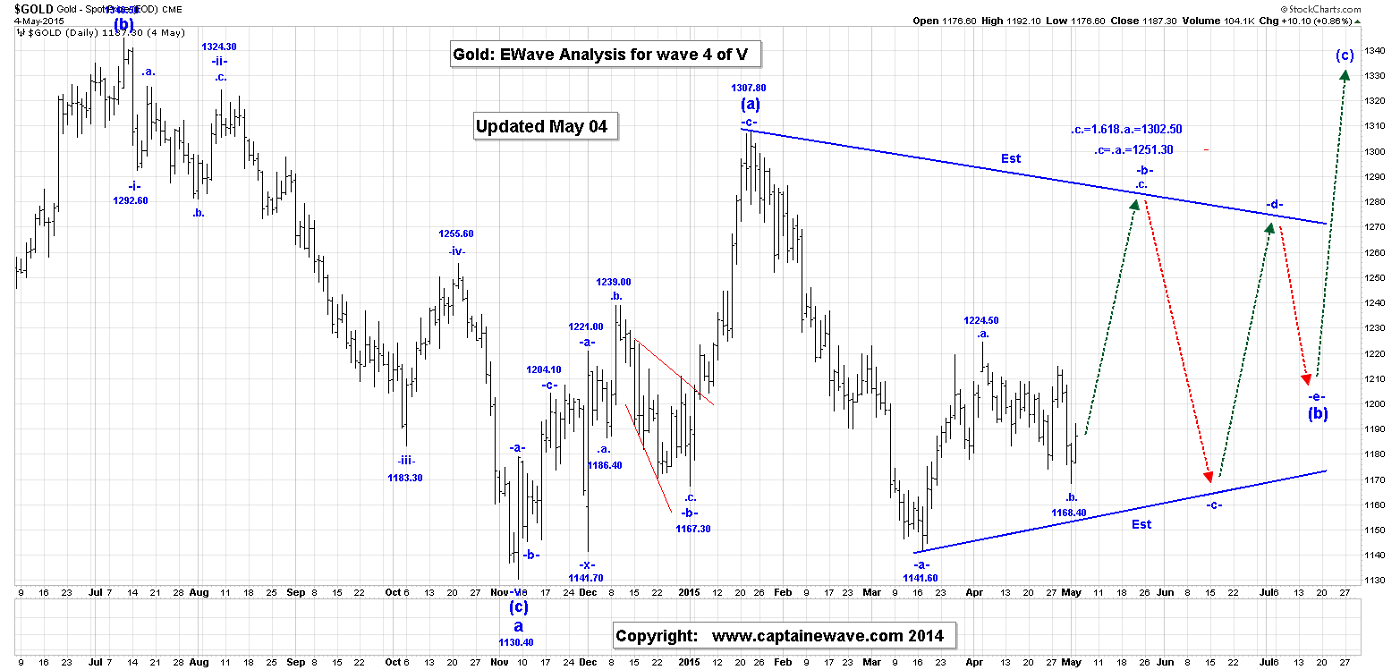
Within wave –b-, we have wave .a. ending at 1224.50 and wave .b. on Friday at 1168.40. We should now be rallying in wave .c., with projected targets of $1251.30 and $1302.50.
The alternate would be our previous count that all of wave (b) ended at $1141.60. In either case, we should be expecting a $100 to $150 rally as the next big event.
The triangle formation in the GDX does require us to consider a different possible outcome for wave (b) for gold than our original idea. We had previously indicated that wave (b) had ended at $1141.60 (daily continuous chart low), but we now believe that wave (b) is likely becoming a bullish triangle, as shown on the Daily Gold Chart.
Gold was higher in the overnight session, reaching $1192.50, as this Post was being written, and then blasting to $1197!
In general, there’s no change to our current thinking as we are now rallying in wave .c. of -a- of our wave (b) triangle. We still expect near trend upside as it is not apparent to use that wave *i* of .c. is complete at the current high of 1192.50. We will wait until we clearly break the 1224/1225 area before we raise our stops to the wave .b low.
The alternate would be our previous count that all of wave (b) ended at 1141.60. In either case, we should be expecting a $100 to $150 rally as the next big event.
We plan to take profits at the end of wave .c.
No change to our current 17 long positions, risking to $1141.30!
Crude Oil

In our last Special Intraday Chart post, we provided a graphic description of wave ^iv^ and all of wave ^v^ as it current exits. The only concern we had with wave ^v^, was that the retracement of wave !ii! seemed a little shallow, so it might be possible that wave !ii! was still underway and was going to become more complex.
In the overnight session, crude moved higher. We believe that wave !ii! probably ended at 58.34. We need a strong break above 59.88, to confirm to us that wave !ii! ended at 58.34.
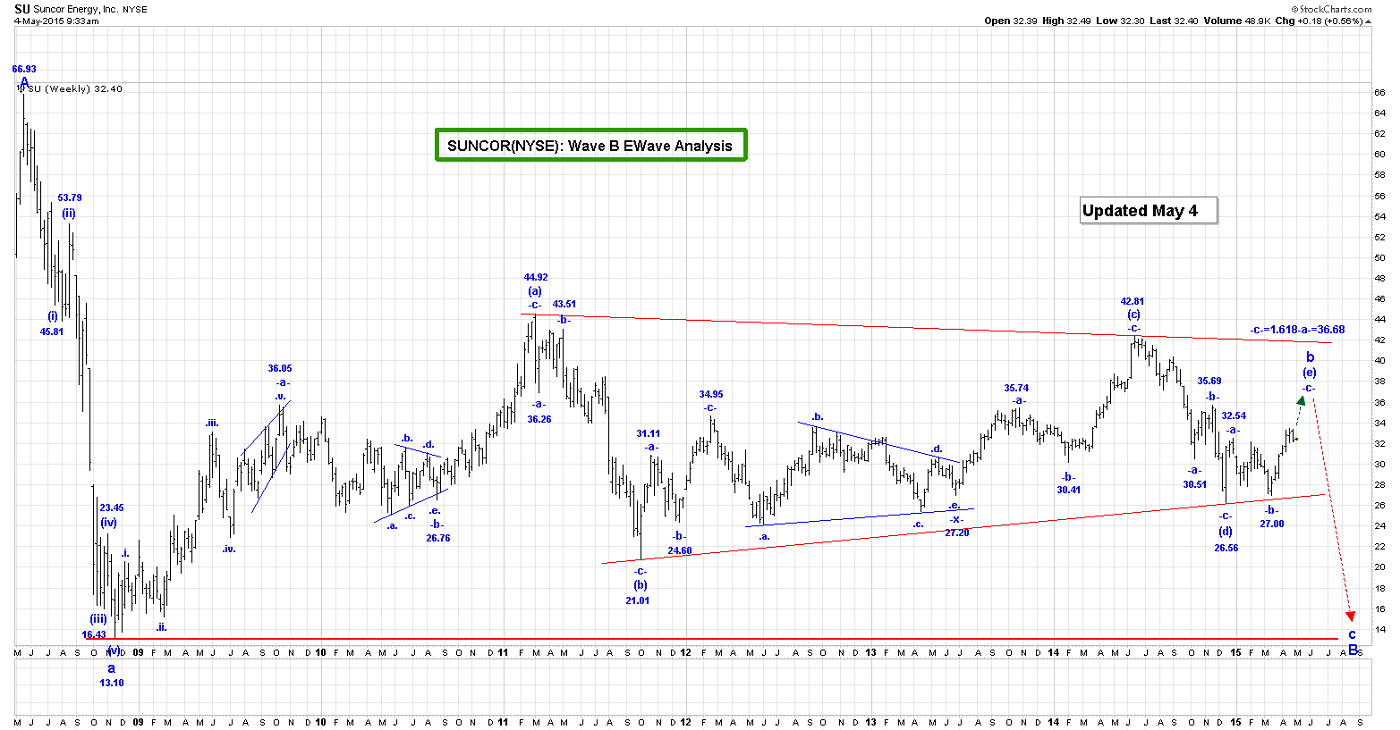
We have attached an updated Suncor Weekly Chart that provided a projection for the end of wave (e), as 36.68. As previously mentioned this is a shorting opportunity and should roughing match the end of wave -iv- in crude. The risk point is clear, at 42.20, on tick above 42.81.
S&P500

There’s no change to our thinking here, as we should now be rallying in wave .c.
Our minimum target for the end of wave .c is the wave .a. high of 2125.92., but we have a projection as high as 2131.14. The S&P was up slightly in the overnight session and this morning.
We plan to short 5 positions at 2075 and 3 positions at 2047.00. Stops will be added when filled.
USDX

We’ve booked fabulous profits on our first batch of USDX shorts. So, what now?
In our last Special Intraday Chart Post we provided graphical details on our wave -iv- correction and have adopted that count as our preferred.
The alternate is the one where wave -v- ended at 100.26 as a failure. In our preferred wave -iv- count we believe that wave *iii* of .c. ended at 94.48 and that the current rally is wave *iv*.
We have projections for the end of wave *iv* at 95.47 and 96.08. In the overnight session the USDX reached a high of 95.77.
Note that we had a couple of other options to consider also. One was that wave *ii* was not complete at 94.48 and that wave .c. and all of wave -iv- had ended at 94.48. Both remain valid, but just barely!
In review, our preferred count for wave -iv- is:
.a. = 94.87;
.b. = 100.26;
.c.:
*i* = 97.18;
*ii* =98.68;
*iii* = 94.48, if complete;
*iv* = 95.77, if complete;
*v* down to go
We have a .c. =1.618.a. projection of 90.83 to watch also.
NatGas

Wave ii in NG likely ended last week at 2.48. We provided an updated Daily NG Chart showing the details of our wave -v- ending diagonal triangle, in our last Special Intraday Chart Post.
With that, our trading strategy will be to go long at the end of wave .ii., risking to 2.47!
We are not sure that wave .i. is complete at 2.80, but if it is our retracement levels for wave .ii. are:
50% = 2.64;
61.8% = 2.60.
Usually when markets break out of diagonal triangles, they will come back and test the trend line that the broke out of, before heading higher. In this case the 2.60 area seems like likely place to buy.
We plan to buy 5 NG at 2.60, risking to 2.47.
HUI/GDX

We have talking about the difficulty that we have been having with finding an impulsive wave structure on the intraday chart of the GDX, since it bottomed at $16.34, back in November, 2014.
The HUI/GDX moved higher this morning, reaching $20.71. This rally is all part of wave (b) or our wave b triangle formation.
From the wave B low of 16.34, it looks like:
a:
(a) = 20.29;
(b) = 16.97;
(c) = 22.93, a wave -v- failure, to complete wave a.
b triangle:
(a) = 17.29;
(b) is still rising;
Waves (c), (d) and (e) to go.
A run to the 22.00 area for the end of wave (b) seems likely. We will likely take profits on our long GDX positons, at the end of wave (b).
We remain long all GDX positions, with stops at $18.37!
CLAUDE RESOURCES (CRJ.T0)

Claude is our “C Wave Bellweather” stock. It really showcases what an Elliot C Wave can bring to the table, in terms of intense upside price action. Investors can book some profit at 90 cents, but we expect the C wave rise to turn this stock into a real twenty bagger!
********
Email: [email protected]
Website: www.captainewave.com
Risk: CAPTAINEWAVE.COM IS AN IMPERSONAL ADVISORY SERVICE. AND THEREFORE, NO CONSIDERATION CAN OR IS MADE TOWARD YOUR FINANCIAL CIRCUMSTANCES. ALL MATERIAL PRESENTED WITHIN CAPTAINEWAVE.COM IS NOT TO BE REGARDED AS INVESTMENT ADVICE, BUT FOR GENERAL INFORMATIONAL PURPOSES ONLY. TRADING STOCKS DOES INVOLVE RISK, SO CAUTION MUST ALWAYS BE UTILIZED. WE CANNOT GUARANTEE PROFITS OR FREEDOM FROM LOSS. YOU ASSUME THE ENTIRE COST AND RISK OF ANY TRADING YOU CHOOSE TO UNDERTAKE. YOU ALSO AGREE TO BEAR COMPLETE RESPONSIBILITY FOR YOUR INVESTMENT RESEARCH AND DECISIONS AND ACKNOWLEDGE THAT CAPTAINEWAVE.COM HAS NOT AND WILL NOT MAKE ANY SPECIFIC RECOMMENDATIONS OR GIVE ADVICE TO YOU OR ANY OF ITS CLIENTS UPON WHICH THEY SHOULD RELY. CAPTAINEWAVE.COM SUGGESTS THAT THE CLIENT/MEMBER TEST ALL INFORMATION AND TRADING METHODOLOGIES PROVIDED AT OUR SITE THROUGH PAPER TRADING OR SOME OTHER FORM OF TESTING. CAPTAINEWAVE.COM, ITS OWNERS, OR ITS REPRESENTATIVES ARE NOT REGISTERED AS SECURITIES BROKER-DEALERS OR INVESTMENT ADVISORS EITHER WITH THE U.S. SECURITIES AND EXCHANGE COMMISSION OR WITH ANY STATE SECURITIES REGULATORY AUTHORITY. WE RECOMMEND CONSULTING WITH A REGISTERED INVESTMENT ADVISOR, BROKER-DEALER, AND/OR FINANCIAL ADVISOR. IF YOU CHOOSE TO INVEST WITH OR WITHOUT SEEKING ADVICE FROM SUCH AN ADVISOR OR ENTITY, THEN ANY CONSEQUENCES RESULTING FROM YOUR INVESTMENTS ARE YOUR SOLE RESPONSIBILITY.
ALL INFORMATION POSTED IS BELIEVED TO COME FROM RELIABLE SOURCES. CAPTAINEWAVE.COM DOES NOT WARRANT THE ACCURACY, CORRECTNESS, OR COMPLETENESS OF INFORMATION AVAILABLE FROM ITS SERVICE AND THEREFORE WILL NOT BE LIABLE FOR ANY LOSS INCURRED. DUE TO THE ELECTRONIC NATURE OF THE INTERNET, THE CAPTAINEWAVE.COM WEBSITE, ITS E-MAIL & DISTRIBUTION SERVICES AND ANY OTHER SUCH "ALERTS" COULD FAIL AT ANY GIVEN TIME. CAPTAINEWAVE.COM WILL NOT BE RESPONSIBLE FOR UNAVAILABILITY OF USE OF ITS WEBSITE, NOR UNDELIVERED E-MAILS, OR "ALERTS" DUE TO INTERNET BANDWIDTH PROBLEMS, EQUIPMENT FAILURE, OR ACTS OF GOD. CAPTAINEWAVE.COM DOES NOT WARRANT THAT THE TRANSMISSION OF E-MAILS, OR ANY "ALERT" WILL BE UNINTERRUPTED OR ERROR-FREE. CAPTAINEWAVE.COM WILL NOT BE LIABLE FOR THE ACTS OR OMISSIONS OF ANY THIRD PARTY WITH REGARDS TO CAPTAINEWAVE.COM DELAY OR NON-DELIVERY OF THE CAPTAINEWAVE.COM NIGHTLY EMAILS OR "ALERTS". FURTHER, WE DO NOT RECEIVE ANY FORM OF PAYMENT OR OTHER COMPENSATION FOR PUBLISHING INFORMATION, NEWS, RESEARCH OR ANY OTHER MATERIAL CONCERNING ANY SECURITIES ON OUR SITE OR PUBLISH ANY INFORMATION ON OUR SITE THAT IS INTENDED TO AFFECT OR INFLUENCE THE VALUE OF SECURITIES.
THERE IS NO GUARANTEE PAST PERFORMANCE WILL BE INDICATIVE OF FUTURE RESULTS. NO ASSURANCE CAN BE GIVEN THAT THE RECOMMENDATIONS OF CAPTAINEWAVE.COM WILL BE PROFITABLE OR WILL NOT BE SUBJECT TO LOSSES. ALL CLIENTS SHOULD UNDERSTAND THAT THE RESULTS OF A PARTICULAR PERIOD WILL NOT NECESSARILY BE INDICATIVE OF RESULTS IN FUTURE PERIODS. THE RESULTS LISTED AT THIS WEBSITE ARE BASED ON HYPOTHETICAL TRADES. PLAINLY SPEAKING, THESE TRADES WERE NOT ACTUALLY EXECUTED. HYPOTHETICAL OR SIMULATED PERFORMANCE RESULTS HAVE CERTAIN INHERENT LIMITATIONS. UNLIKE AN ACTUAL PERFORMANCE RECORD, SIMULATED TRADES DO NOT REPRESENT ACTUAL TRADING. ALSO, SINCE THE TRADES HAVE NOT ACTUALLY BEEN EXECUTED, THE RESULTS MAY HAVE OVER OR UNDER COMPENSATED FOR THE IMPACT, IF ANY, OF CERTAIN MARKET FACTORS SUCH AS LACK OF LIQUIDITY. YOU MAY HAVE DONE BETTER OR WORSE THAN THE RESULTS PORTRAYED. NO REPRESENTATION IS BEING MADE THAT ANY ACCOUNT WILL OR IS LIKELY TO ACHIEVE PROFITS OR LOSSES SIMILAR TO THOSE SHOWN. NO INDEPENDENT PARTY HAS AUDITED THE HYPOTHETICAL PERFORMANCE CONTAINED AT THIS WEBSITE, NOR HAS ANY INDEPENDENT PARTY UNDERTAKEN TO CONFIRM THAT THEY REFLECT THE TRADING METHOD UNDER THE ASSUMPTIONS OR CONDITIONS SPECIFIED HEREAFTER. WHILE THE RESULTS PRESENTED AT THIS WEBSITE ARE BASED UPON CERTAIN ASSUMPTIONS BELIEVED TO REFLECT ACTUAL TRADING CONDITIONS, THESE ASSUMPTIONS MAY NOT INCLUDE ALL VARIABLES THAT WILL AFFECT, OR HAVE IN THE PAST AFFECTED, THE EXECUTION OF TRADES INDICATED BY CAPTAINEWAVE.COM. THE HYPOTHETICAL RESULTS ON THIS WEBSITE ARE BASED ON THE ASSUMPTION THAT THE CLIENT BUY AND SELLS THE POSITIONS AT THE OPEN PRICE OF THE STOCK. THE SIMULATION ASSUMES PURCHASE AND SALE PRICES BELIEVED TO BE ATTAINABLE. IN ACTUAL TRADING, PRICES RECEIVED MAY OR MAY NOT BE THE SAME AS THE ASSUMED ORDER PRICES.
More from Gold-Eagle


