Gold Shorts Made A Killing, Other’s Not…So What Now?


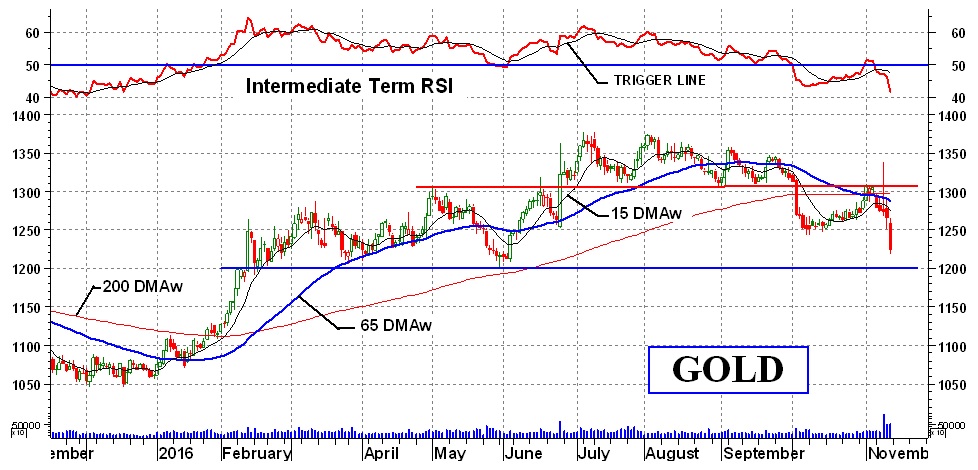
The 658% bull move mentioned here a couple of weeks ago is temporarily postponed, until the snowflakes get a grip. Let’s see how that $1,200 support level holds up (well, I think I mentioned $1,190 previously but what’s a few dollars here or there?). Apart from the devastation of this past week is there anything in the charts to give us some hope? Only a look will tell.
The market action is trapped within a “box” that stretches back to February. It got out of the box but its actions were weak (based upon a weakening momentum) and didn’t go far or last long. The latest attempt at a reversal to the up side was also pretty weak and fell down once it hit the upper resistance level. The intraday action on Tuesday was an election phenomenon not to be a consideration. Other than a negative momentum action the most critical item on today’s chart is the volume action of the past couple of days. I watch volume but do not often mention it as it only gives us some serious information on rare occasions, like right now. With the huge trading volume on the past down days in gold, this suggests that there is a lot of dumping (or selling, or shorting) going on. With such activity one would usually consider this the action of the professionals, those with money. These professionals are not always right but let’s go with the flow. The move should take us to that initial short-term $1,190 mark. It will be instructive what the reaction will be at that level. It is a strong support level but the heavy volume of the last few days may take the gold price right past the support. This is a very risky time to initiate any new action as the support is too close for any profit potential and to assume that gold will break below support (for short trading) is a fools guess at this point. Just sit back and see which way things develop before initiating any new contracts, buy or short.
Long-Term
A couple of weeks ago my rating for the long term was – Neutral, well, things have changed. The gold price has dropped below its negative sloping moving average line and the long term momentum indicator is now in its negative zone below a negative sloping trigger line. The rating is now a full BEARISH rating. Confirming this negativeness is the fact that both the short and intermediate term moving average lines are below the long-term line.
Intermediate-Term
I have been bearish on the intermediate term for some time now and nothing has changed. I must confess that the intermediate term did go bullish for 3 days at the beginning of November but quickly turned back to the bearish. It remains BEARISH on the intermediate term. The short term moving average line remains below the intermediate term line for confirmation.
Short-Term
As previously suggested, the short term rally was a rather weak bull and it collapsed upon reaching that resistance level at $1,300 and of course there were the election results. One should always be cautious with sudden panic action such as happened after the election. Inevitably, the initial reaction in the majority of cases (as far as I can determine) will not be held up over time. In fact going in opposition to the initial reaction can bring significant profits to speculators, in gold as well as in the stock markets.
The gold price is once more below its negative sloping moving average line and the momentum indicator is in its negative zone below a negative trigger line. The rating is now a full BEARISH rating.
Looking at a short term chart we have an interesting development. Although the intermediate term momentum indicator is below its previous low from early October the short term momentum indicator is still above its early October level. We may have a short term positive divergence in the works although it has not been completed yet. Something to watch.
Gold And Silver Stocks
This past week has been a disaster for gold and silver stocks with losses in the double digit all around. In my own mind I think this is all panic reaction to an election that most speculators did not do their homework on and were not expecting the results. They paid attention to the major media, which is always a dangerous thing to do when speculating with your capital. The major media have their own agenda and one should always check with NON major media sources to find out what is really going on. The election was predicted by many in these non major sources.
The table shown today includes the weekly results of the various precious metals markets that I follow (not all but the major markets). The LATEST WEEKLY column gives us the devastating results of this past week. The BULL RUN column gives us the performance of each Index from its low point in late 2015/early 2016 to its recent high point. The LATEST BEAR column provides the performance from the recent high to the Friday close. All performances are based upon weekly closing prices to provide a valid comparison between Indices.

Merv’s Gold And Silver 100 Index
Without labouring the point the rating of the 100 Index is BEARISH for the long, intermediate and shorter term. There were only 8 stocks advancing this past week with 92 declining. The overall BULL/BEAR performance for these 100 stocks is 9% positive and 86% negative on the shorter term, 10% positive and 87% negative on the intermediate term and 14% positive and 81% negative on the long term.
Merv’s Silver 30 Index
Without labouring the point the rating of the 30 Index is BEARISH for the long, intermediate and shorter-term. There were only 2 stocks advancing this past week with 28 declining. The overall BULL/BEAR performance for these 30 stocks is 3% positive and 82% negative on the shorter-term, 3% positive and 90% negative on the intermediate-term and 5% positive and 92% negative on the long-term.
Merv’s Penny Arcade 50 Index
Without labouring the point the rating of the 50 Index is BEARISH for the intermediate and shorter term, the long term rating is not quite bearish yet and is at a – NEUTRAL rating, one level above a full bear. There were only 7 stocks advancing this past week with 40 declining and 3 going nowhere. The overall BULL/BEAR performance for these 50 stocks is 14% positive and 77% negative on the shorter term, 8% positive and 85% negative on the intermediate term and 8% positive and 87% negative on the long term.
As the table shows, the Merv’s Penny Arcade 50 Index had the best overall performance during the bull market of 2016 and the second best as far as the bear market goes, to this point.
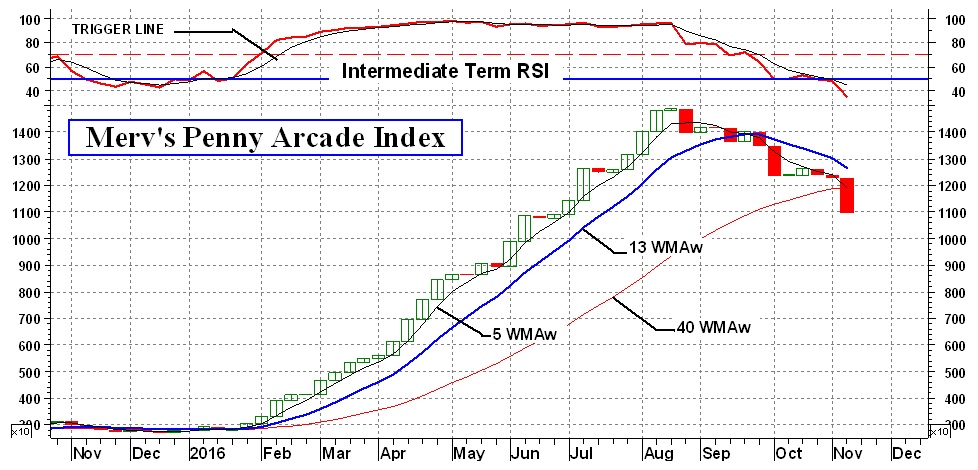
After a superb performance earlier in the year the Penny Arcade topped out in August and it’s been downhill ever since. Most speculators have been told to avoid these “cats and dogs” as they are too speculative. Performance seems to say otherwise. The Penny Arcade Index was developed in early 2007. It went through an immediate bear market bottoming out in late 2008. Since then it has acted quite well. The PHLX Gold/Silver Sector Index (XAU) bottomed out about the same time. At Friday close the XAU was only ahead by 10.1% above that late 2008 bottom. As for the Penny Arcade, it is ahead 5,935% during this same period.
With that I’ll leave the commentary for another week, more likely two weeks.
Readers are invited to view my Facebook page at https://facebook.com/merv.burak where I will be slowly posting commentaries explaining in more detail my various indicators and techniques. I also present from time to time some individual stocks that look as if they may be good speculations. However, nothing I post is meant to be a recommendation to buy or sell. One should check with their broker or investment advisor before acting.
 Merv is a retired Aerospace Engineering consultant. He is also a retired market technician with over 40 years of market experience and research. Merv received his certification as a Chartered Market Technician (CMT) in 1992. Developer of many technical techniques and programs which he has been using in his previous Technically Speaking with Wil-Arm and Technically Precious with Merv commentaries posted throughout the globe. Developer of several gold and silver Indices, Merv continues to update his Merv’s Gold & Silver 100 Index and Merv’s Penny Arcade 50 Index and reviews them during his periodic on-going Technically Precious commentaries.


