Gold & Silver Update


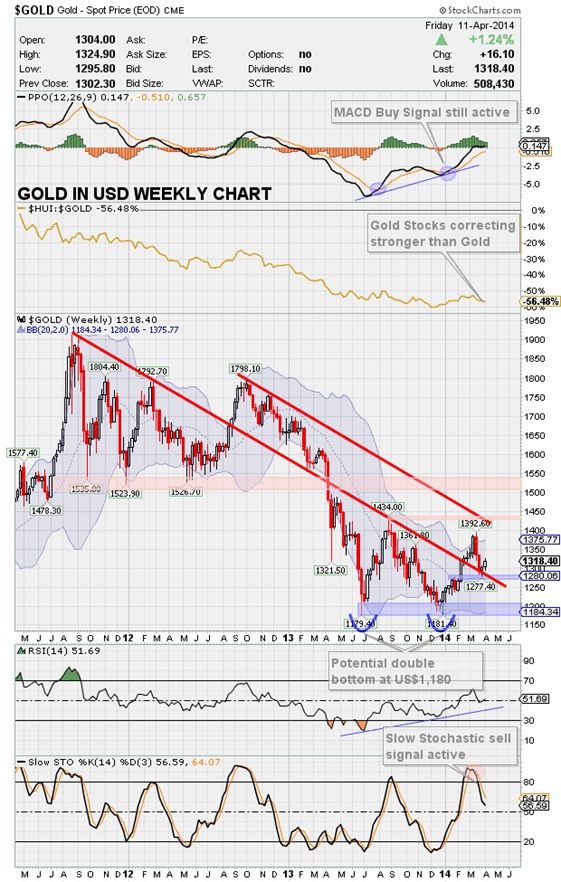
In my last analysis I clearly explained that Gold had just finished its up-leg and that one had to expect some form of a deeper correction.


|
Arguments for lower prices:
|
|
|
|
********
Germany
E-Mail: [email protected]
Website: www.goldnewsletter.de
 Florian Grummes (born 1975 in Munich) has been studying and trading the Gold market since 2003. In 2008 he started publishing a bi-weekly extensive gold analysis containing technical chart analysis as well as fundamental and sentiment analysis. Parallel to his trading business he is also a very creative & successful composer, songwriter and music producer. You can reach Florian at: [email protected].


