Gold & Silver Update


Long-Term nothing has changed. Precious Metals bull market continues and is moving step by step closer to the final parabolic phase (could start in summer 2014 & last for 2-3 years or maybe later).
Arguments for lower prices:
- Gold overall still in a downtrend. US$1,525 is the line in the sand. Gold will need much more time to break through this heavy resistance.
- Gold has been breaking down from the last triangle pattern now just barely holding above the June lows.
- Gold remains very weak and there are no signs of a trend change or at least a recovery.
- A daily close below US$1,180 would signal that the downtrend continues and should lead to the final stage of this multiyear correction targeting US$1,135.00 - US$980.
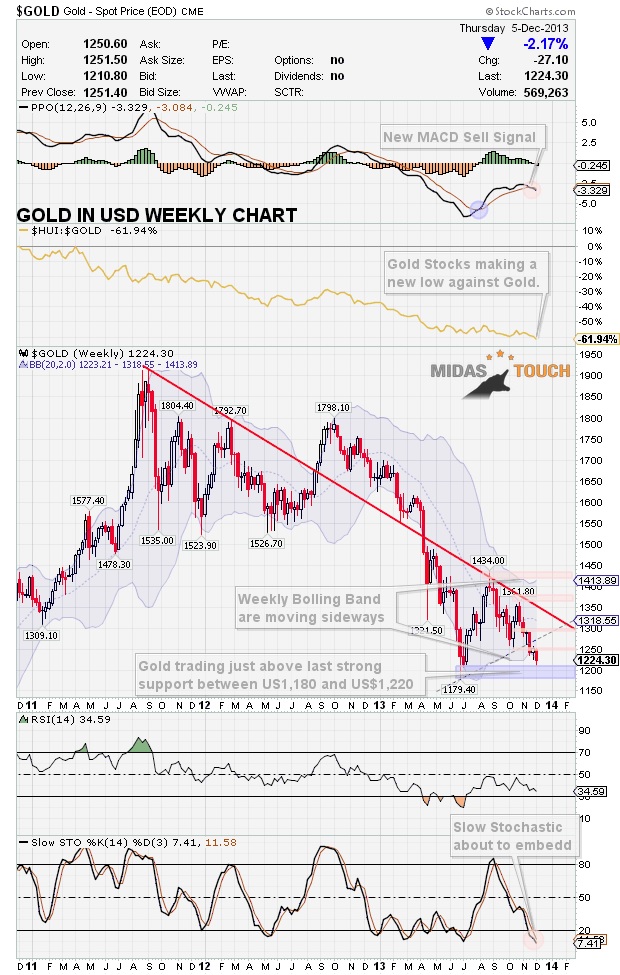
- Monthly Chart: MACD sell signal active since November 2011 (this is extremely powerful and needs to change before one can call the bottom, but MACD histogram is already turning higher from oversold levels…).
- Weekly Chart: New MACD sell signal about 10 days ago (this is negative, but could also turn out to be whipsaw action during bottom building phase...)
- Weekly Chart: Slow Stochastic Oscillator with both signal-lines below 20 this week and therefore starting to embed. It takes three weeks to embed. If this happens Gold will continue to fall and US$1,135.00 - US$980.00 becomes a very realistic target.
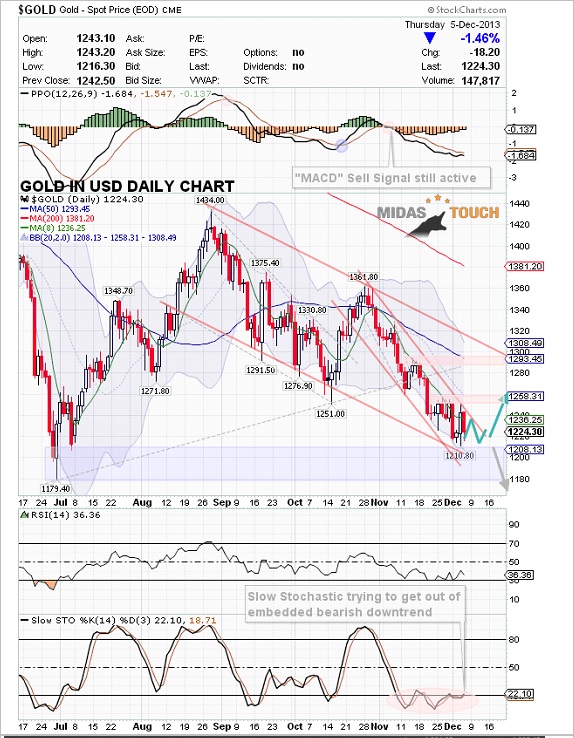
- Daily Chart: MACD sell signal active since early November (but getting „long in the tooth“....)
- Daily Chart: Gold clearly trading below falling 50-MA (US$1,293) and below falling 200-MA (US$1,381). This alone defines a bear market.
- Daily Chart: Slow Stochastic Oscillator has been embedded below 20 for many days. With the bounce on Wednesday the Oscillator managed to break out of this devastating state only to fall back into it yesterday (bull-trap). An embedded Slow Stochastic is a very powerful signal that overwrites any other technical analysis. An embedded Slow Stochastic means that the trend is locked in and will continue.
- We have seen two impressive short-squeezes in the Gold-market during the last 12 days but Gold did not manage to close above US$1,250. Instead each spike has been sold off again. Either this is the final whipsaw action during the bottom building process or this is classic bear-market action where the market occasionally manages to place dramatic spikes only to slowly grind lower thereafter.
- Goldstocks are already trading below their June lows!
- HUI daily Chart: Slow Stochastic Oscillator clearly embedded on the downside. Very negative!
- Gold/Silver Ratio continues to move higher. It now takes 63.14 ounces of Silver to buy one ounce of Gold. There are no signs of a trend-change yet.
- From a sentiment perspective you would expect to see no retail demand at market lows but physical demand by small investors continues to be very robust.
- ETF Gold holders continue to liquidate their positions.
- Deflationary forces gaining power. For example the banking situation in Central & Eastern Europe is deteriorating rapidly as can be seen by Poland confiscating Pensions, the Czech Republic wanting the ability to debase their currency by deferring Euro usage, Slovenia’s ‘Cyprus like’ banking problems etc. From the Balkans to the Baltic States the problems are increasing and Draghi is acutely aware of what this means to EU. The ECB must drive the Euro down soon or the Euro Banking crisis, which was never resolved but only obscured, will take the banks into an even worse crisis.
Arguments for higher prices:
- Besides disappointing price action Gold is still holding above the June lows at US$1,180.00.
- Weekly Chart: Lower Bollinger Band (US$1,223.21) is moving sideways and therefore offers even stronger support for Gold.
- Daily chart: Lower Bollinger Band (US$1,208.13) supporting Gold.
- Daily chart: Slow Stochastic Oscillator is trying to break out of embedded status. This would help to start a rally from oversold levels.
- Long-term fundamental: Gold cannot be printed while the balance sheets of the biggest central banks are exploding („Gold is the reciprocal of faith in central banks“ - Jim Grant).
- Long-term fundamental: Central banks are losing faith in each other and countries like China, South-Korea, Mexico, Russia, Ukraine etc. have been increasing their gold holdings in the last 2 years.
- Long-term fundamental: China continues to buy as much gold as they can get their hands on. Imports via Hong Kong have been exploding over the last couple of years.
- Major Buy Zone for the HUI around 150 - 170 points is very close already. Downside very limited here.
- Last week´s Commitments of Traders report shows that speculators have been pushing short-side bets on precious metals. Total speculator positions in gold, silver, copper, platinum and palladium are nearing decade-long lows, second only to several weeks in late June and early July. At the same time the commercials are only 28,236 contracts net short. The latest report coming out tonight might show an even more extreme position. Long-term this is extremely bullish for Gold.
- The latest Public Opinion data show a continued plunge in sentiment towards Gold and Silver. Silver is nearing its lowest level since 2001. Sentiment is at least as awful as in late June 2013.
- Seasonality is very positive for the second half of December. As well seasonality generally remains very supportive until mid of February for the precious metals sector.
- As Marc Faber put it: "Gold is bottoming out here. We have a lot of bearish sentiment and a lot of bearish commentaries about gold, but the fact is that...prices are probably in the process of bottoming out here".
- Commercials continue to be net long on the Euro. This will help the precious metals sector because the US-Dollar bounce is already over. A weaker US-Dollar normally means higher Gold and Silber prices.
- Investment managers have never been this aggressively exposed to the stock market. Share buying on margin hit all-time highs. Gold and western stock-markets are moving clearly inverse since about 2.5 years. Historically this has been the norm. As soon as the stock-market bubble will pop precious metals should start to rise again. (but this could take more time of course..)
- We continue to be amidst an unprecedented global debt crisis. Any default would be far too painful therefore most western central banks continue trying to inflate the debt away. The FED will have to continue with QE and might even increase it. "Tapering" will not happen.
- US-budget & debt ceiling theatre will start again in january....
Conclusion:
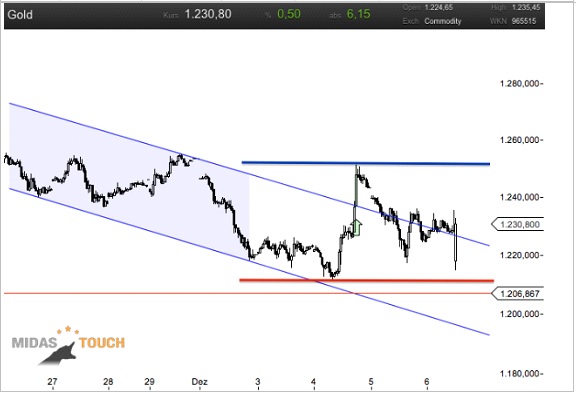
- Two weeks ago bears managed to break the triangle support at US$1,267 and Gold quickly moved lower down to around US$1,208. Since then we can observe a nervous back and forth between US$1,210 and US$1,250. The bears are clearly in control as none of the recent short-squeezes proofed to be sustainable.
- The conclusion for traders is simple. Stand at the sidelines as long as this crazy sideways movement continues. The bulls will need a daily close above US$1,250. In that case one could go long with a first target around US$1,293. If instead Gold closes below US$1,210 the odds favor at least a test of US$1,180 if not much lower prices (e.g. US$980).
- Personally I still believe that Gold and Silver are bottoming out here and that the downside risk is limited. Bulls seem to be able to defend US$1,210 today again.
- Investors with a long-term perspective should continue to accumulate physical Gold and Silver while they are beaten down and trading below production cost.
Long-term:
- Nothing has changed
- Precious Metals bull market continues and is moving step by step closer to the final parabolic phase (could start in summer 2014 & last for 2-3 years or maybe later)
- Price target DowJones/Gold Ratio ca. 1:1
- Price target Gold/Silver Ratio ca. 10:1
- Fundamentally, Gold should soon start the final 3rd phase of this long term bull market. 1st stage saw the miners closing their hedgebooks, 2nd stage continuously presented us news about institutions and central banks buying or repatriating gold. The evolving 3rd and finally parabolic stage will end in the distribution to small inexperienced new investors who will be subject to blind greed and frenzied panic.
********
Germany
E-Mail: [email protected]
Website: www.goldnewsletter.de
 Florian Grummes (born 1975 in Munich) has been studying and trading the Gold market since 2003. In 2008 he started publishing a bi-weekly extensive gold analysis containing technical chart analysis as well as fundamental and sentiment analysis. Parallel to his trading business he is also a very creative & successful composer, songwriter and music producer. You can reach Florian at: [email protected].
More from Gold-Eagle


