Gold, The Simple Math


The current pullback in the precious metals sector is a buying opportunity. Since trading at a closing high of $2,064 an ounce on August 6, gold bullion has declined 8.34% as of this writing.1 Gold mining shares have followed suit, declining 9.26% since the August high. It is possible that gold and related mining shares could continue to chop sideways to lower until the U.S. presidential election results are known and even into yearend as the implications are sorted out. Whatever the electoral outcome, the path towards monetary debasement is bipartisan. It is crucial for investors to focus on the long-term trend and to avoid the distractions of short-term timing considerations.
The very strong investment fundamentals for gold and gold mining shares are based on what has been a slow irreversible drift towards significant U.S. dollar (USD) devaluation. Paper assets, including equities, bonds and currencies, have underperformed the dollar gold-price since 2000, the dawn of radical monetary experimentation by central bankers. Until recently, gold's strength has attracted little notice from mainstream investors. Widespread disinterest can perhaps be ascribed to the stealthy, long-term character of gold's outperformance. In addition, the absolute performance of equities and bonds has been positive over the past two decades, so there has been little incentive to look elsewhere.
Figure 1. Gold vs. Stocks, Bonds and USD
Relative Returns for Period from 12/31/1999-9/30/2020

Source: Bloomberg. Period from 12/31/1999-9/30/2020. Gold is measured by GOLDS Comdty Index; S&P 500 TR is measured by the SPX; US Agg Bond Index is measured by the Bloomberg Barclays US Agg Total Return Value Unhedged USD (LBUSTRUU Index); and the U.S. Dollar is measured by DXY Curncy. Past performance is no guarantee of future results. You cannot invest directly in an index.
Lack of Crowd Recognition Provides Opportunity
The underappreciated advance in the precious metals complex may well continue over the intermediate term. Lack of crowd recognition provides an opportunity to accumulate positions ahead of more heated price competition that we believe is very likely in the months ahead. While the investment consensus slumbers, it may be helpful to consider the potential upside for both gold bullion and gold mining equities and resist the urge to trade the metal's secular bull market. To paraphrase the late market analyst Richard Russell,3 "It is the nature of every bull market to take along the fewest possible number of investors for the entire ride."
We believe that now is the time to start layering in gold exposure, not when the rest of the world tries to do so.
In simple mathematical terms, the gold market could not clear at current prices if 1% of the $100 trillion4 or so of institutional assets under management were to move into the physical metal. Record year-to-date inflows into gold-backed ETFs have exceeded any previous year. But in dollar terms, this amounts to a paltry $51.2 billion requiring the acquisition of 936.2 metric tonnes of gold (according to Meridian Macro Research). By contrast, a $1 trillion inflow into gold bullion would require 18,000-19,000 tonnes, equal to roughly six years of annual world gold production. A shift of this magnitude by asset allocators would require a bullion price of $5,000-$10,000 an ounce.
Figure 2. Gold-Backed ETF Flows Have Reach Record Levels in 2020 (2003-2020)
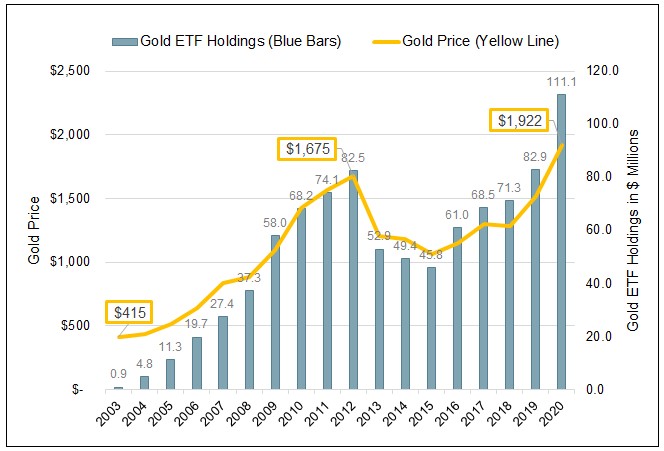
Source: Bloomberg. Period from 12/31/2003-10/02/2020. Gold is measured by GOLDS Comdty Index. Gold ETF Holdings is measured by the ETFGTOTL Index. You cannot invest directly in an index.
Paper Money Supply Growth Will Outstrip Available Gold
The time frame for a hypothetical $1 trillion inflow could range from a few years to a decade. As the supply of paper money accelerates, a $1 trillion inflow could prove conservative. What is inescapable is that the future increase in the supply of U.S. dollars is likely to far outstrip the 1-2% annual growth in gold supply. Monetary regime change, not cyclical or episodic (COVID) related factors, explains the steepening slope in the supply of paper currency versus gold.
On September 16, Federal Reserve ("Fed") Chairman Powell announced a new QE (quantitative easing) program that is twice the size of earlier QE programs in terms of monthly credit expansion. Under the current program, the Fed will purchase $80 billion of U.S. Treasuries and $40 billion of mortgage-backed securities per month net. This will lead to a 21% increase in the Fed balance sheet over the next twelve months. Powell stated:
"Effectively, we're saying that pace will remain highly accommodative until the economy is far along in its recovery.... We do have the flexibility to adjust that tool and the rate tool and other tools, as well."
Sustainable V-Shaped Recovery is Highly Unlikely
Implied in Powell's comment is the expectation that the U.S. economy will recover to pre-COVID levels and that further Fed support will be unnecessary. His thinking assumes that business cycle factors plus cures for COVID-19 will restore normality, which will allow the Fed to withdraw support for financial markets. We believe that Powell, his Fed colleagues and consensus economic thinking do not comprehend that the highly indebted U.S. and world economy are incapable of a sustainable V-shaped recovery. More likely is a continuation of sub-par economic performance that will be viewed as unacceptable by the next and future presidential administrations.
Highly indebted economies are destined to underperform their potential. Productive resources must be diverted to debt service and principal repayments to meet credit obligations. Monetary policy is handcuffed because any tightening, including interest rate hikes, will increase the risk of credit defaults and economic instability. Lenders become reluctant to extend credit at sub-economic rates when borrowers are swimming in debt. Therefore, future monetary and fiscal interventions are likely to increase in scale and frequency. Extraordinary measures will become routine.
Before the onset of the COVID economic shutdown, U.S. consumer, business and government debt totaled $64 trillion or more than three times the U.S. gross domestic product.5 That ratio is most assuredly greater today and, with continuing government and corporate debt issuance, will continue to grow. High debt drives a vicious cycle of money creation that cannot be reversed without an extended period of austerity.
Excessive indebtedness practically guarantees that interest rates will remain tethered to the zero bound. As of September, the blended interest rate on U.S. debt was 1.77%, a record low. The fiscal year (FY) 2020 interest expense was $522 billion through September and will approximate $560 billion for the full fiscal year ending October 31. A 1% increase would add over $300 billion in interest expense. As noted by FFTT (Forest for the Trees, 9/24/2020) authored by Luke Gromen,6 on a year-to-date basis, interest expense plus entitlement spending equaled 97% of tax receipts. Taking defense spending into account, spending on automatic pilot is $1.4 trillion. Assuming interest rates do not increase, we estimate the growth of embedded non-discretionary spending to be 5-10% annualized.
Figure 3. Interest Rates are Zero Bound

Source: Meridian Macro Research LLC. Data as of 10/03/2020. You cannot invest directly in an index.
Toss in additional stimulus and other ongoing government programs, and one can easily picture routine deficits of $2-3 trillion and annual growth in U.S. Treasury debt of 15-20%, well in excess of gross domestic product (GDP) growth. As noted by Gromen, with federal spending accounting for 45% of GDP, any attempts to cut outlays "will effectively amount to a cut in GDP." Proposed tax increases would likely trigger a new recession. The U.S. no longer has fiscal choices.
Monetary policy is also trapped. The Fed is morphing into an arm of the U.S. Treasury, as former Fed Governor Kevin Warsh observes in a September 7 Wall Street Journal Op-Ed:
"If the economy does well in the coming quarters, I expect the Fed will expand significantly the scale, scope and duration of its asset purchases. If the economy weakens or financial markets fall, the Fed will do even more. This is what political scientists call path dependency. When an institution sticks to a path for so long, it finds its options limited, detours difficult and exits infeasible.
"The Fed is on a one-way path to a larger role in our economy and government. On the current trajectory, the Bank of Japan might be the model for Fed policy: a large buyer of public stocks and an indistinguishable partner with fiscal authorities. The unimaginable can become the inevitable."
Bonds and Equities Have Become Positively Correlated
The emasculation of the Fed means that bonds can no longer protect conservative, balanced portfolios against equity risk. Bonds and equities have become highly correlated. The inverse equity/debt correlation assumes a normal business cycle in which bonds and equities would travel in opposite directions during recessions and recoveries.
At the zero bound, bonds offer only return-free risk. Upside potential seems entirely dependent on appreciation linked to crossover into negative nominal territory, certainly a possibility but only speculation for the sophisticated investor. Downside risk would be considerable if the U.S. dollar weakened, inflation returned or if the yield curve steepened. If bonds have reached a dead end, asset allocators must look elsewhere. Gold will fill a large part of the void vacated by bonds to help balance equity risk.
Figure 4. Correlation of Spot Gold to Traditional Financial Assets

Source: Bloomberg. Period from 9/30/2000-9/30/2020. Gold is measured by GOLD Comdty Index; U.S. Equities by the S&P 500 Index; U.S. Cash by the S&P US Treasury Bill 0-3 Month Index; International Equities by the MSCI EAFE Index; U.S. Fixed Income by the Bloomberg Barclays US Aggregate Bond Index; and Real Estate by the Dow Jones US Select REIT Index. You cannot invest directly in an index.
Asset allocators may also soon discover that gold mining equities offer dynamic exposure to a falling U.S. dollar and a rising gold price. Despite good performance year-to-date, up 37.86% (as measured through 10/13/2020 by GDX7) versus a 24.66% year-to-date increase in the gold price, flows into mining shares have been lackluster. Shares outstanding of GDX are 15% below the peak in 2017 despite nearly doubling in value.
Figure 5. GDX Shares Outstanding are Down 15% from 2017 Levels (2006-2020)

Source: Bloomberg. Period from 5/12/2006-10/12/2020. You cannot invest directly in an index.
Against a very favorable macroeconomic backdrop, gold bullion and gold mining stocks appear to be significantly under represented. The Meridian Macro Figure 6. chart shows that gold-backed ETFs and related mining stocks represent only 0.91% of the aggregate market capitalization of world exchanges, a ratio well below the prior peak reached in 2011.
Figure 6. Gold Miner Mkt. Cap Physical Gold ETF Holdings Value as % World Exchange Market Cap vs. Gold ($/oz)

Source: Meridian Macro Research LLC. Data as of 10/03/2020. You cannot invest directly in an index.
Gold mining shares represent unprecedented value relative to their history and in comparison to conventional equity alternatives. For example, miners trade at EV/EBITDA (enterprise value to earnings before interest, taxes, depreciation and amortization)8 of 8.52x compared to the equal-weighted S&P 500 of 16.33x, the widest spread in 10 years.
Figure 7. Gold Mining Equities vs. S&P 500 Index: EV/EBITDA (2006-2020)
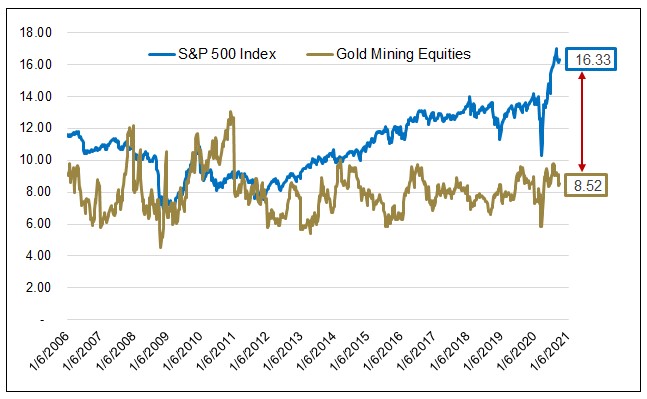
Source: Bloomberg. Data as of 10/12/2020. S&P 500 Index is measured by the SPXEVEBT Index and Gold Mining Equities are measured by the GDMEVEBT Index. You cannot invest directly in an index.
In addition, the ratio of the HUI Index9 to the gold price stands at 0.18, indicating that gold miners are cheap relative to gold bullion. This compares to a range of 0.14 to 0.64 during the bull market from 2000-2010, as shown in Figure 8.
Figure 8. The HUI-Gold Ratio Measures Investor Sentiment on Gold

Source: Bloomberg. Data as of 10/12/2020. The orange line measures the ratio of the HUI Index to GOLDS Comdty Index. You cannot invest directly in an index.
The gold mining sector is financially robust thanks to the strong bullion prices and significant debt reductions made possible by healthy cash generation. Dividend hikes have become frequent and there is plenty of room for more to come. Our research indicates that twelve mining companies have announced dividend increases in 2020. Payout ratios are still low and conservative. There is considerable room for further increases as companies become more comfortable with a gold price of $1,900. Year-over-year earnings comparisons will be favorable due to higher average gold prices in 2020 versus 2019. A favorable outlook for gold bullion prices means rising future earnings. The still shunned sector could gain favor with growth stock investors.
We are frequently asked how gold mining stocks might behave in a broad market setback similar to March 2020 or 2008. Market meltdowns occur when investors sell whatever they can to raise cash. No asset class or stock group is immune to panic liquidations, including gold and gold mining stocks. More critical, gold and gold mining stocks were quick to recover from market panics and deliver subsequent outperformance, as shown in Figure 9.
Figure 9. Gold Mining Equities Performance (2008-2020)
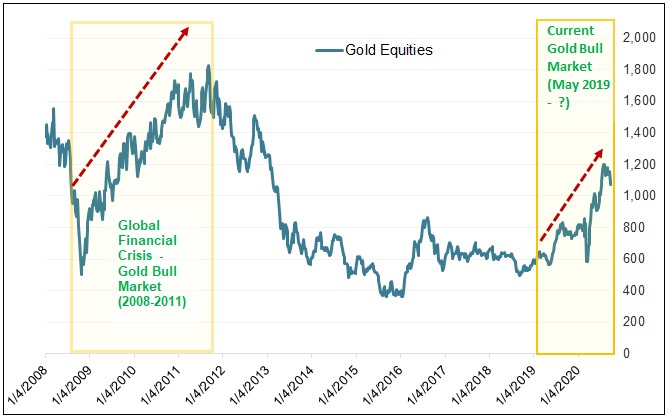
Source: Bloomberg. Data as of 9/30/2020. Gold mining equities are measured by the NYSE Arca Gold Miners Index (GDM). You cannot invest directly in an index.
Are Markets Priced for "Destruction"?
On the other hand, the downside risk in mainstream equity portfolios is considerable and, in our opinion, requires more protection than ever. By almost any benchmark, the stock market (measured by the S&P 500 Index10) is equal to or more overvalued than at its 2000 peak.
|
Metric |
2000 |
2020 |
|
Market Cap/GDP |
139.5% |
176.6% |
|
PE/Estimated Earnings |
26x |
25x |
|
S&P x Sales |
2.5x |
2.5x |
|
S&P x EBITDA |
14.7 |
15.7 |
Source: Bloomberg. Data as of 9/30/2020.
As hedge fund manager Michael Solomon of Marlin Sams Fund, L.P. summed up on October 3:
"The markets are priced for destruction... Investors ignore the fact that real corporate after-tax profits (US Bureau of Economic Analysis) have been flat since 2010... Since 2008, the markets have crashed/cracked four times (including the bond market's taper tantrum)…The mass delusion is that the Federal Reserve can save the day. We believe that as the Fed gets further in, it will find itself trapped in a position from which it cannot get out. Investors believe things are good, but they are not. The illusion has been supported only by the reckless, extreme, and irresponsible actions of the Fed."
High financial asset valuations are addicted to Fed support. In our opinion, there is little risk that Fed support would or could be withdrawn. Fiscal stimulus is likely to continue as well. As argued in Mr. Solomon's synopsis above, the consensus illusion of well-being is dependent on ever greater money creation.
In our view, new episodes of money creation, market intervention, or price rigging add to systemic instability. Conditions caused by the next financial accident mirroring the GFC (great financial crisis) or black swan event echoing the COVID-19 pandemic could render monetary and fiscal countermeasures ineffectual. A substantial devaluation of the U.S. dollar would take place.
Layer in Gold Exposure
Ray Dalio noted in his study, The Changing World Order, "most people don't pay enough attention to their currency risks." He recently reiterated his earlier prediction of a 30% decline in the U.S. dollar within the next few years. Most investors assume the dollar will retain constant value. We believe that is wrong. Dalio points out that all paper currencies have been devalued or died. No exceptions.
We believe that now is the time to start layering in gold exposure, not when the rest of the world tries to do so.
A cursory inspection of the U.S. fiscal situation suggests that the U.S. dollar deserves to rank high on the endangered species list. There are many ways that a dollar devaluation could transpire. Inflation, pronounced loss of value against other currencies, or a deflationary credit meltdown are all possibilities. In any of these scenarios, the dollar price of gold would rise.
The four-year rise in gold from $1,100 at yearend 2015 to $1,900 in 2020 is an early signal of a failing currency regime. We believe that potential exists for the dollar price of gold to rise more than 5-10 fold when that failure becomes plain for all to see. It is a matter of simple math. Timing remains uncertain but the outcome seems inevitable.
|
1 |
The price of gold is measured by spot gold price, which refers to the price of gold for immediate delivery. |
|
2 |
As measured by Sprott Gold Miners Exchange Traded Fund (NYSE Arca: SGDM), an ETF that seeks investment results that correspond (before fees and expenses) generally to the performance of its underlying index, the Solactive Gold Miners Custom Factors Index (Index Ticker: SOLGMCFT). The Index aims to track the performance of larger-sized gold companies whose stocks are listed on Canadian and major U.S. exchanges. |
|
3 |
Richard Russell was an American writer on finance. He began publishing a newsletter called the Dow Theory Letters in 1958. The Letters covered his views on the stock market and the precious metal markets. As of 2015, Dow Theory Letters was the longest-running service continuously written by one person in the business. |
|
4 |
Source: Boston Consulting Group, May 2020. |
|
5 |
|
|
6 |
Luke Gromen, CFA, is founder of the macroeconomic research firm Forest for the Trees (FFTT). FFTT publishes a bi-monthly, in-depth macroeconomic & thematic newsletter for institutional investors. |
|
7 |
VanEck Vectors Gold Miners ETF (GDX) tracks the overall performance of companies involved in the gold mining industry. |
|
8 |
The EV/EBITDA ratio is a popular metric used as a valuation tool to compare the value of a company, debt included, to the company's cash earnings less non-cash expenses. |
|
9 |
The NYSE Arca Gold BUGS Index (HUI) is a modified equal dollar weighted index of companies involved in gold mining. BUGS stands for Basket of Unhedged Gold Stocks. |
|
10 |
The S&P 500 Index (SPX) is an index of stocks issued by the 500 largest U.S. companies. Important Disclosure Past performance is no guarantee of future results. You cannot invest directly in an index. This content is intended solely for the use of Sprott Asset Management USA, Inc. for use with investors and interested parties. Investments, commentary and statements are unique and may not be reflective of investments and commentary in other strategies managed by Sprott Asset Management USA, Inc., Sprott Asset Management LP, Sprott Inc., or any other Sprott entity or affiliate. Opinions expressed in this content are those of the author and may vary widely from opinions of other Sprott affiliated Portfolio Managers or investment professionals. This content may not be reproduced in any form, or referred to in any other publication, without acknowledgment that it was produced by Sprott Asset Management LP and a reference to sprott.com. The opinions, estimates and projections (“information”) contained within this content are solely those of Sprott Asset Management LP (“SAM LP”) or its affiliates and are subject to change without notice. SAM LP makes every effort to ensure that the information has been derived from sources believed to be reliable and accurate. However, SAM LP and affiliates assume no responsibility for any losses or damages, whether direct or indirect, which arise out of the use of this information. SAM LP and affiliates are not under any obligation to update or keep current the information contained herein. The information should not be regarded by recipients as a substitute for the exercise of their own judgment. Please contact your own personal advisor on your particular circumstances. Views expressed regarding a particular company, security, industry or market sector should not be considered an indication of trading intent of any investment funds managed by SAM LP or its affiliates. These views are not to be considered as investment advice nor should they be considered a recommendation to buy or sell. SAM LP and/or its affiliates may collectively beneficially own/control 1% or more of any class of the equity securities of the issuers mentioned in this report. SAM LP and/or its affiliates may hold short position in any class of the equity securities of the issuers mentioned in this report. During the preceding 12 months, SAM LP and/or its affiliates may have received remuneration other than normal course investment advisory or trade execution services from the issuers mentioned in this report. The information contained herein does not constitute an offer or solicitation to anyone in the United States or in any other jurisdiction in which such an offer or solicitation is not authorized or to any person to whom it is unlawful to make such an offer or solicitation. Prospective investors who are not resident in Canada or the United States should contact their financial advisor to determine whether securities of the Funds may be lawfully sold in their jurisdiction. The information provided is general in nature and is provided with the understanding that it may not be relied upon as, nor considered to be, the rendering or tax, legal, accounting or professional advice. Readers should consult with their own accountants and/or lawyers for advice on the specific circumstances before taking any action. |
*********
 John Hathaway, CFA, Senior Managing Director, Co-Portfolio Manager
Mr. Hathaway is a co-portfolio manager of the Tocqueville Gold Fund, as well as other investment vehicles in the Gold Equity Strategy. Mr. Hathaway also manages separately managed accounts for individual and institutional clients. He is a member of the Investment Committee and a limited partner of Tocqueville Asset Management (www.tocqueville.com). Mr. Hathaway began his career in 1970 as an Equity Analyst with Spencer Trask & Co. In 1976, he joined investment advisory firm David J. Greene & Co., where he became a partner. In 1986, he founded Hudson Capital Advisors and in 1988 became Chief Investment Officer of Oak Hall Advisors. He joined Tocqueville as a Senior Partner in 1998. Mr. Hathaway has a BA degree from Harvard College and an MBA from the University of Virginia.


