Gold Stocks: Make History Rhyme in Your Favor
 share
share
 share
share
 share
share
 share
share
 share
share
They say that the history rhymes and that’s generally true. Sometimes, the rhymes are almost identical. Like right now in the miners.
GDXJ Correction Deja Vu
You see, the thing (that I let my subscribers know about in yesterday’s intraday message) is that the move higher that happened yesterday in the mining stocks is in perfect tune with what we saw during the previous topping pattern.
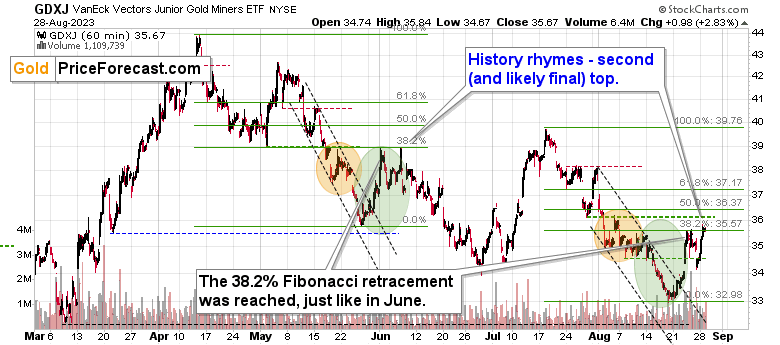
Back in June, when the GDXJ was correcting the April-May decline, it corrected in exactly the same way as what we see now and to the same retracement – the 38.2% one.
I added orange and green ellipses to the above chart to make the similarity even more obvious.
Let’s pause here for a moment. Why would the moves be so similar at all? They are a few months apart, and quite many important things happened in the meantime.
But you know what didn’t change? The fact that people are emotional beings, and they buy when they are greedy and they sell when they are fearful. And when do people get greedy or fearful? That depends on many factors, but ultimately, people look at the price, right? There are certain ways in which the price can move that then triggers specific – emotional – reactions.
For example, there’s nothing inherently bullish about a rally, and there’s nothing inherently bearish about a decline. Just because the price moved up or down on the previous day, doesn’t mean that the same thing will happen next. A rally or decline refers to the past, and being bullish or bearish refers to the future. Interestingly, a top can form only after a rally, and a bottom can form only after a decline, and one wants to buy at the bottom and sell at the top, right?...
And yet, most people will see rallies as bullish and declines as bearish.
Now, a rally or a decline are the simplest possible patterns, and there are more sophisticated ones. Some of them are called “price formations”, for example, the “head and shoulders pattern”. However, the self-similar rule and the entire concept behind it also applies to price moves that don’t have those distinct names – especially if we see them on the same market relatively close to each other.
Familiar Patterns Expected
Why would those two conditions be important? Because it means that it’s very likely that it’s the same group of people that is going to respond to very similar price moves. Well, has anything changed in market participant’s emotional resilience? Heh, maybe if they participated in the RISE sessions, it would, but most people haven’t. So, the thing is that given the same kind of input, the same (approximately) group of people is likely to get into the same kind of dynamics, thus causing the same kind of follow-up action in the market.
That’s why the GDXJ is now likely to move lower.
Of course, there’s also the context – what happens in other markets. If it wasn’t the case, the above mechanism would likely work all the time and not “just” most of the time.
The more similar the “context” is, the more likely the situation is to repeat itself.
Right now, the general stock market provides very interesting details.
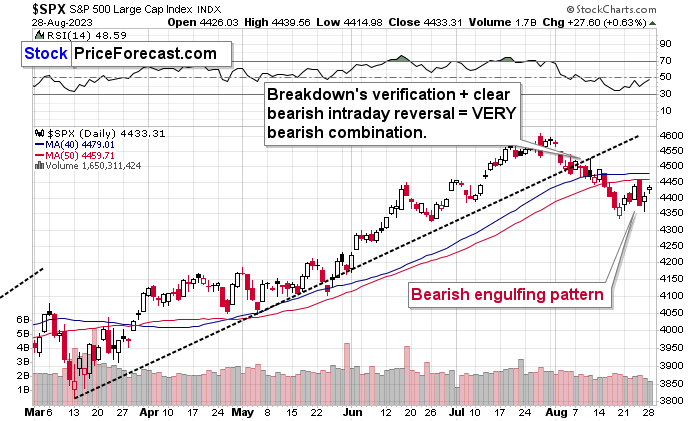
The S&P 500 moved higher yesterday, but that wasn’t a new short-term high, and in fact, this back-and-forth trading creates the right shoulder of the head and shoulders pattern (with the mid-June top as the left shoulder).
Given this situation, it was normal for miners to move higher yesterday, and it will be very normal for them to slide in the following weeks (maybe even days).
And then, quite likely, months. You know, the world doesn’t end with U.S. stock indices, and there’s an entire index comprised of global stock indices except for the U.S. ones.
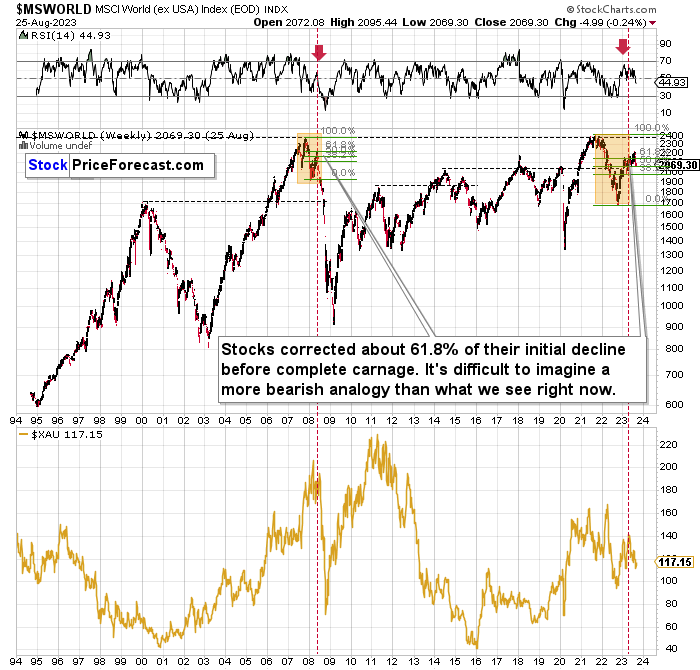
This index is like the flagship of all self-similar patterns that are currently in play. After topping at its 2008 high, the index fell and then corrected 61.8% (ok, a bit more) of the initial decline. That’s as much as it had corrected back in 2008.
And when that correction was finally over, the true carnage started. The fundamental background has been there for quite some time now – the interest rates have risen substantially in the previous months, and markets sort of pretend as if it hadn’t happened. This is a major blow to the economy as credit is much more expensive, and everyone is going to be affected, even if they aren’t affected yet.
The markets are emotional, and it was easy for people to just cling to the hopeful narrative that markets can only go up, forgetting that periodic slides are normal.
Moving back to the self-similar pattern, once the RSI (upper part of the chart) was back below 50 in 2008, it was a clear final warning. Then, the carnage unfolded.
Well, we just saw the same thing. The index is back below its 61.8% Fibonacci retracement, and RSI is visibly below 50.

Oh, and by the way, mining stocks (as seen in the lower part of the above chart) plunged along with world stocks in a truly epic manner back in 2008, and they are already declining now…
So, while it’s true that we just profited on a quick, long position in the mining stocks, it looks like the next huge move is going to be to the downside after all. And it seems that we might not need to wait for this move to begin for long, either.
********
share
share
share
share
share
 Przemyslaw Radomski, CFA, is the founder, owner and the main editor of SunshineProfits.com. You can reach Przemyslaw at: http://www.sunshineprofits.com/help/contact-us/.