Gold Stocks Re-Taking the Macro as it Creeps Counter-Cyclical
 share
share
 share
share
 share
share
 share
share
 share
share
Here is the planetary representation I came up with called the Macrocosm. The larger the planet, the more positively relevant to gold mining macro fundamentals.
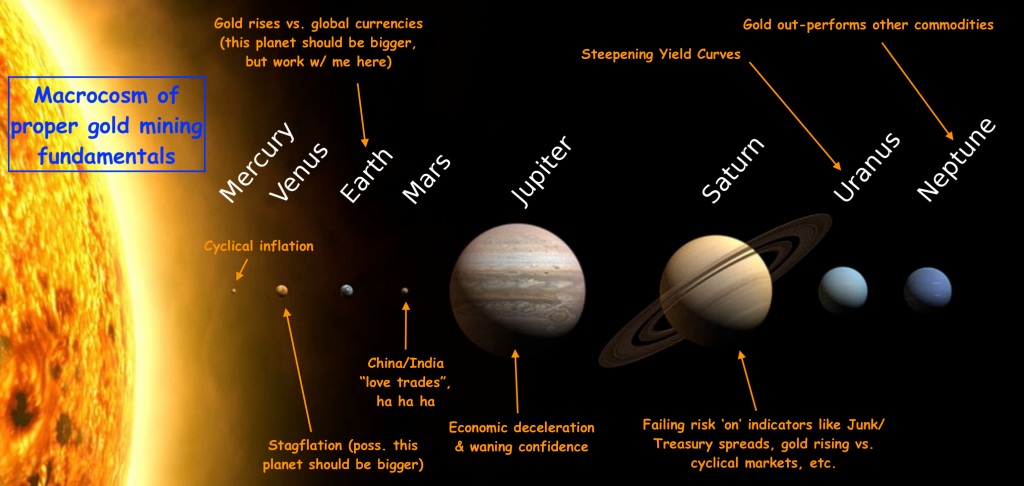
Okay, out of curiosity I used WordPress’s AI function to producer an image for the word “Macrocosm” and here’s what it produced. Not bad, AI! It actually looks like there’s a lot of mayhem out ahead in the Macrocosm and thus, the macro markets in general. Actually, it looks a little like the inside of Trump’s brain formulating trade policy, compared to my nice, orderly solar system above.

Moving on, the crash of 2008 was earned. The great bear market that began in 2012 was earned as well. Both for the general reasons stated above as a cyclical inflationary macro held sway under policymakers’ firm control. Bernanke, especially.
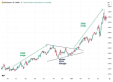
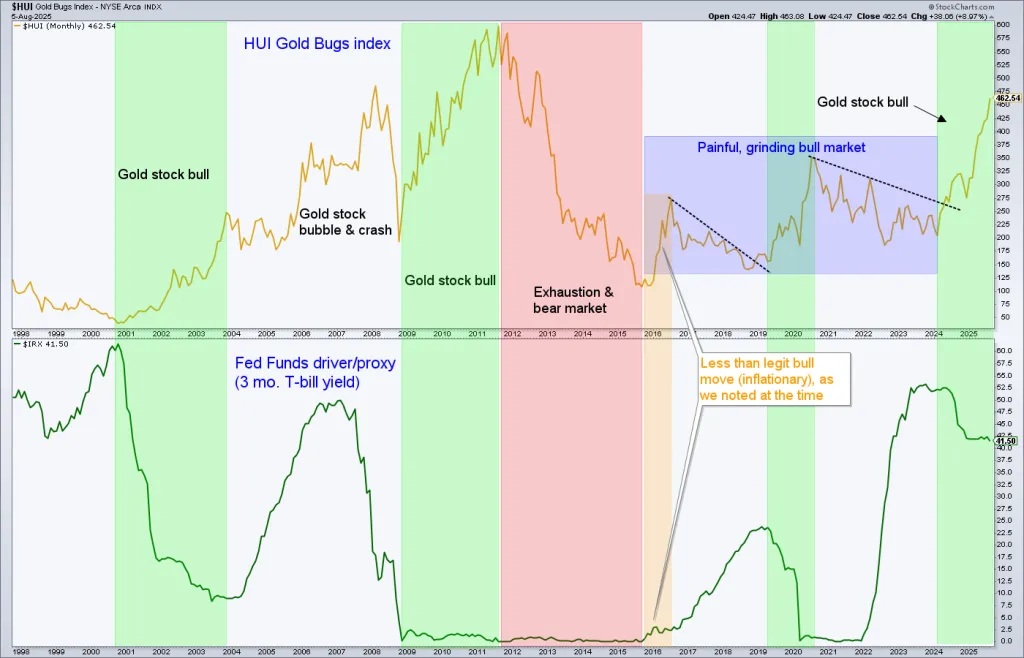
Let’s look at a big picture as we review a short story. The HUI Gold Bugs index bottomed hard in 2015, from the terrible bear market that began in 2012; a bear market that was largely deserved. With the exception of the 2001-2003 phase and a brief post-crash phase in 2008-2009, the remainder of the previous bull market ground along against unfavorable macro fundamentals as cyclical inflation – that is, inflation working positively in unison with an economic cycle – degrades the gold mining industry as miners’ costs rise relative to their product. In other words, they suffer margin compression.
Below the chart we’ll review some notes starting from the end of that terrible bear market.
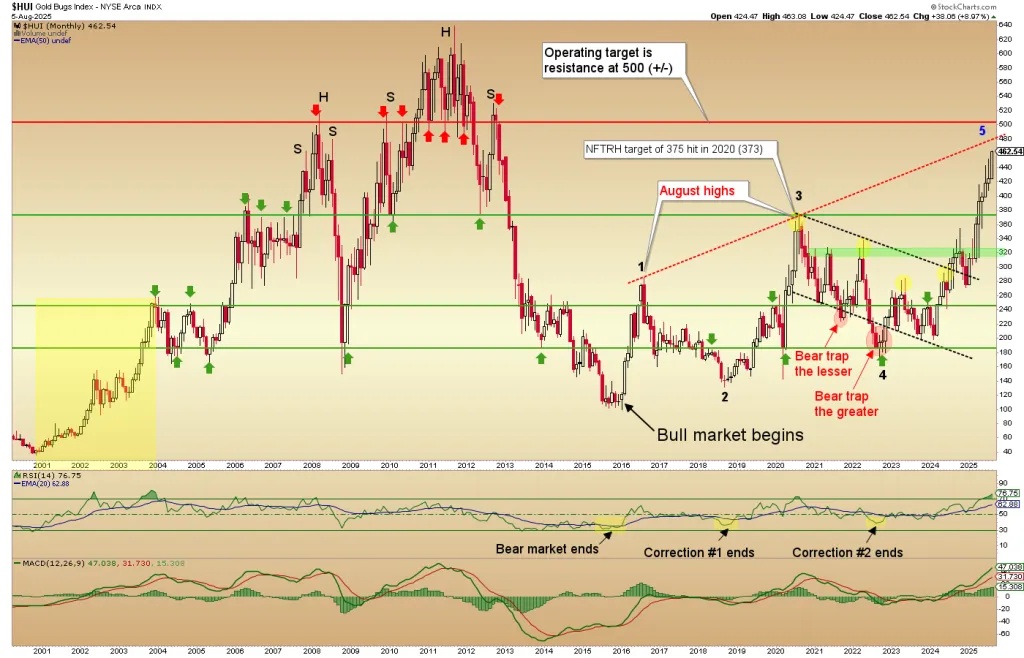
Silver led the sector’s explosion off of the December, 2015 low into a fabulous but ill-fated rally in H1, 2016. Silver’s leadership was a problem for the gold mining industry because its leadership over gold opened the gates for commodities and cyclical markets to come through. Come through they did. We had an inflationary cyclical, not counter-cyclical environment. The gold miners were logically doomed by August of that year.
The first multi-year correction ensued (1>2), bottoming at a higher low. At this point we began to theorize that HUI was in a new bull market.
Bull market up leg 3 began and was rudely interrupted by the Covid crash before bottoming amid major deflationary pressure and leading the macro up into the inflationary bailouts by Fed and government. At the point, HUI in essence hit our upside target of 375 (373), gold formed the right rim of its massive and bullish Cup pattern, and silver began a grind downward as well. All this as the balls out inflation manufactured by the Fed and government in H1, 2020 took hold. It was logical for the overbought precious metals to take a long nap.
Bull market down leg 4 broke many a spirit in the gold bug community, but as long as 4 would not make a lower low, it was still a bull market. A horribly painful one that bled out every last bit of enthusiasm created in 2020. That was its job. Again, it was cyclical inflation that impaired the sector.
In Q4, 2022 the sector bottomed, began leg 5 up, ground into 2023 and began to grind upward in 2024. This as we began seeing new counter-cyclical signs in the economy (beyond the scope of this article). By Q1, 2025 the macro-fundamentals began to turn up hard: Gold “real” price rising vs. stocks, commodities, currencies, etc.
From January into April’s unsustainable momentum (upside in gold, downside in stocks) gold asserted upon the macro and solidified the miners’ investment thesis as not only psychological considerations like gold vs. the stock market were in play, but so too were nuts and bolts operational fundamentals like gold vs. mining cost commodities (esp. Energy commodities).
As to the chart’s technicals, for the last 1.5 years we have been targeting 500 (+/-) on HUI. As you see, we are almost to target. It does not need to be a stop sign. For example, gold took out my target of 3000+, in place since 2020 on the Cup’s measurement, with authority. Might HUI do the same? It could.
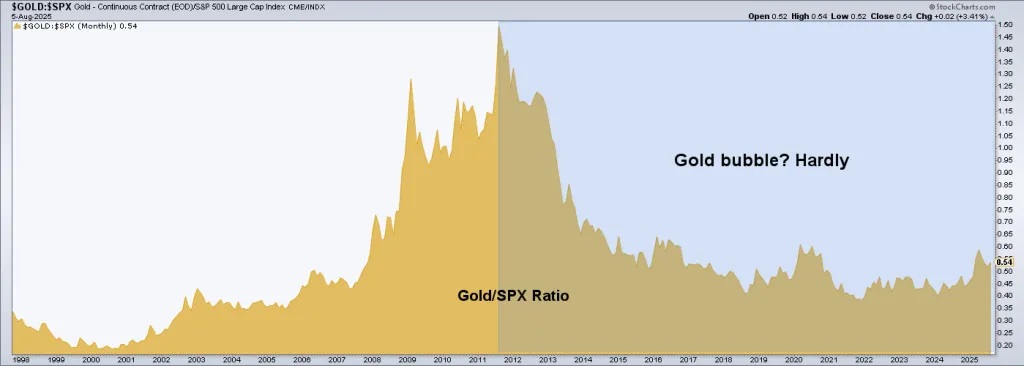
Speaking of gold, let’s grab a big picture look. This is a launch into the new macro.
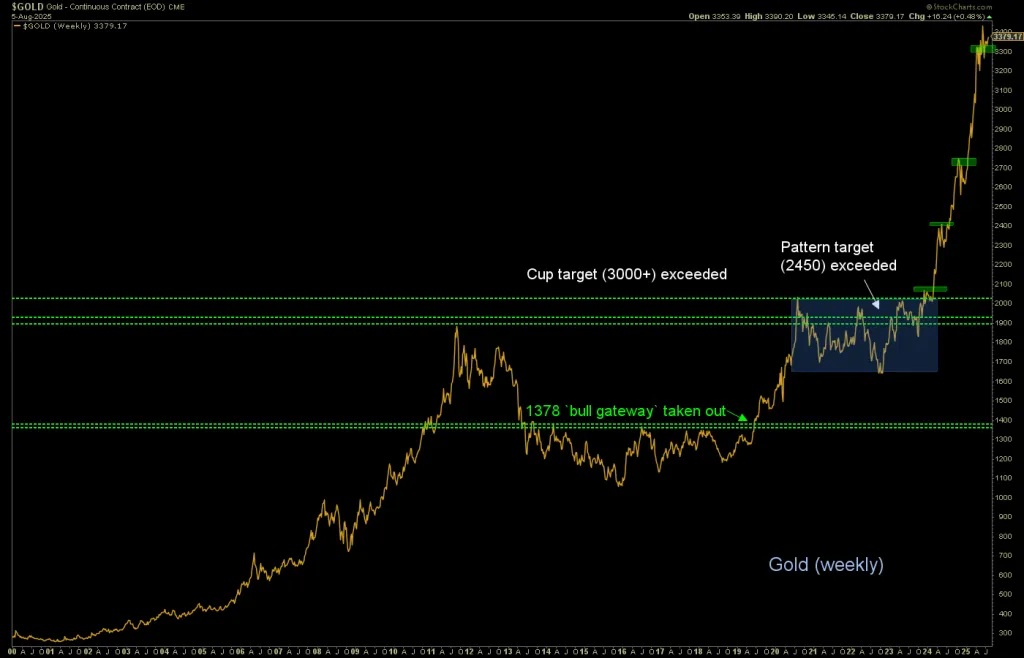
What this is not, is a bubble…
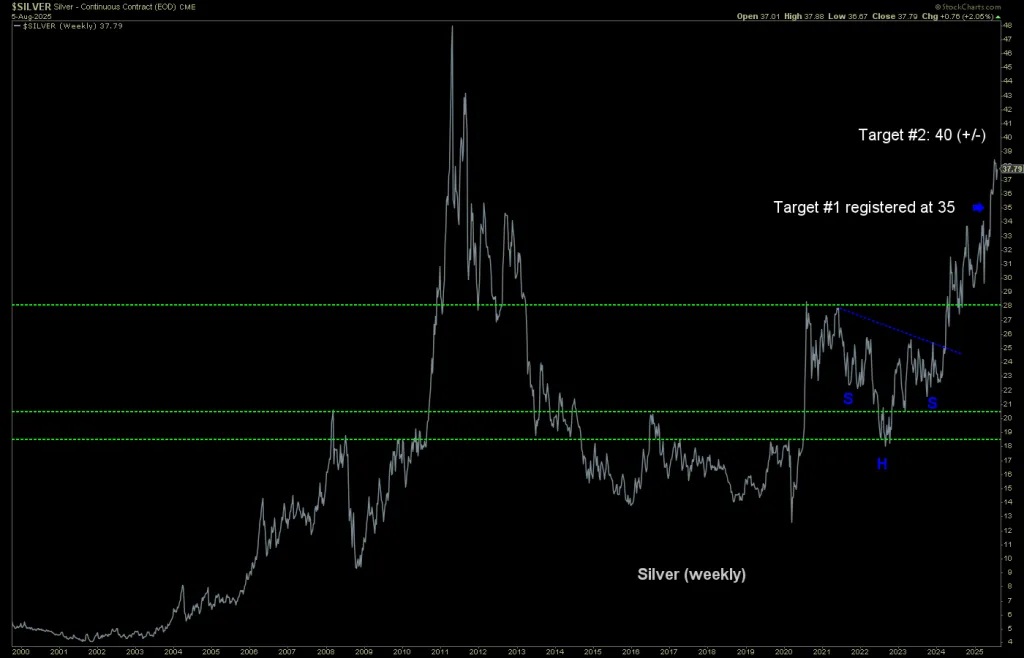
Silver came close to target. Again, not a stop sign. A target. It looks like the 2011 high and the old 1970s Hunt Brothers high are going to get taken out with little problem. The question being whether it will happen on this bull cycle or perhaps after a sector and/or broad market correction/bear.
Back to gold stocks, with gold outperforming stocks, commodities and currencies, they are unique and set up to leverage negative events elsewhere in the macro. As the economy continues to decelerate pressure will build on the Fed to cut the Funds rate.
This chart weighs in to advise how a combination of a dovish Fed and an economy in contraction has tended to benefit gold stocks (HUI). Today, HUI is front running further rate cuts. If they unexpectedly don’t happen, Huey will be vulnerable. If they do happen, a positive factor will slam into place, with the question being how much of the bullishness will Huey have already front-run?
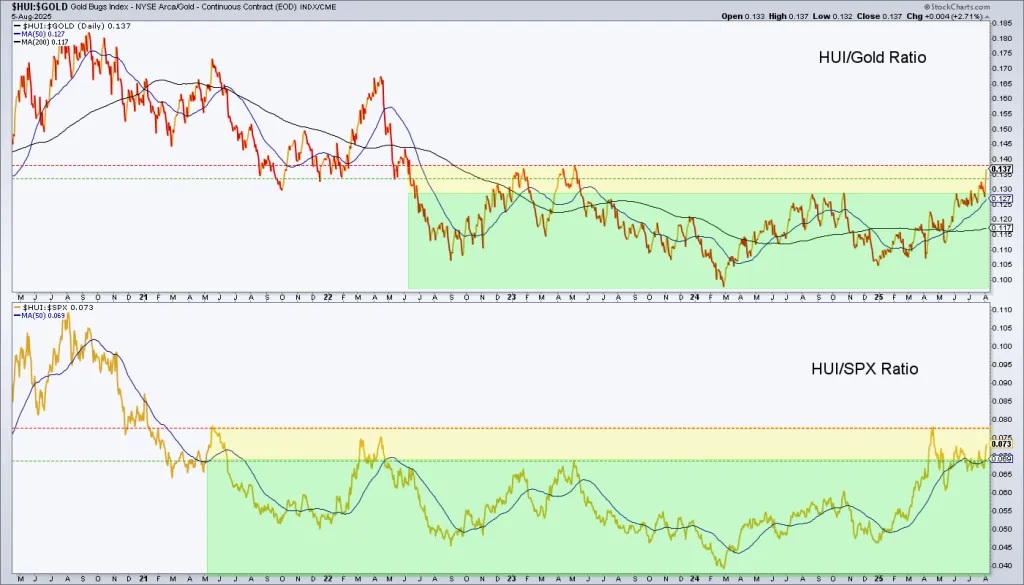
Meanwhile, here is a market “internal” picture of gold stocks (HUI) attempting to break out of bases in terms of both gold and the S&P 500. It’s been a long time coming; long after most people wrote off this infernal sector.
There are so many more elements (and associated charts) to this story. But for a public article I’ll need to clip it here. I’ll be watching probably 20 (+/-) different macro charts and indications to be sure the situation stays on track or be ready if it does not. Meanwhile, I have been patiently cobbling a group of quality gold miners, developers and even a small basket of exploration stocks while taking partial profits here and replanting there.
One thing is for sure. The situation is on track from the 2016 bottom. That is 9 years of “on track”. From an actionable standpoint, we are about 1.5 years in. I have rarely enjoyed managing the markets as I have been in 2025. So many balls up in the air (again, have a look at Trump’s AI generated brain above), so much noise, but also several macro indications simply marching forward to the oncoming bust cycle and counter-cycle.
Consider an affordable subscription to NFTRH if you’d like to come along.
For “best of breed” top-down macro analysis and market strategy covering Precious Metals, Commodities, Stocks and much more, subscribe to NFTRH Premium, which includes a comprehensive weekly market report, detailed NFTRH+ updates and chart/trade setup ideas, and Daily Market Notes. Receive actionable (free) public content at NFTRH.com and subscribe to our free Substack. Follow via X @NFTRHgt and BlueSky @nftrh.bsky.social, and subscribe to our YouTube Video Channel. Finally, check out Hammer’s trade (long and/or short) setups.
********
share
share
share
share
share
More from Gold-Eagle