Hello To 2018…
 share
share
 share
share
 share
share
 share
share
 share
share
…and goodbye to 2017, which is ending with a last gasp effort from the precious metals as gold closes the year just above the long defended $1300 level and silver makes it back above $17.00 at the close. The DJIA had its own new all-time high at 24837.51 on Thursday, but on Friday it was dragged lower by end of year selling – tax related perhaps? – not the typical selected ramping higher by fund managers trying to edge up their places on the ranking order. 2017 was a great year for Wall Street and the Trump administration. This has set a high bar as a target for 2018. Can the economy and the keen support for Wall Street continue to deliver?
The major market related feature of 2017 is the 1400% gain of Bitcoin. However, it looks as if the brief break above $20 000 a week before Christmas, starting from about $6500 in mid-November, could remain an intermediate high for some time – if it does not turn out to be the all time high. Five days later the price bottomed at $10 400 before settling sideways mostly around the $14 000 level.
A brief jump to above $16 000 was quickly smashed lower by the large overhang of ‘investors’ who had bought Bitcoin during the frantic run higher to $20 000, then saw bargains shortly after the top. These buyers are now eager to close their losing positions without too much loss and will sell each rally. The early December feeding frenzy appears to be over, at least for now. The longer the sideways drift continues, the fewer new buyers will enter the market, while many frustrated investors will be closing positions whenever the price bounces. The sustained increase in price that is needed to ignite widespread demand again is unlikely to happen soon.
Bitcoin’s only intrinsic value is its anonymity, which applies to all cryptocurrencies. Not all 1000+ of Bitcoin’s peers can be expected to survive for long, but those few that do will in effect compete with Bitcoin on level ground as the means to complete anonymous transactions. If competition keeps prices of these cryptocurrencies in a narrow and stable price range, say a few tens of dollars, perhaps a few hundred, far below $20 000, they may even become popular as a hidden haven for ‘hot money’.
The other eye-catching feature of 2017 is the bull market on Wall Street, with the DJIA starting the year at 19 394 and ending 5300 points (27.5%) higher at 24 719. That is a big move under circumstances of a struggling economy, a feud around the White House and a number of major natural disasters. Belief that the steep increase of the DJIA is turbo-assisted means it will not surprise to have the trend continue into 2018. Herb Stein has warned that something that cannot continue indefinitely, will stop. Perhaps this new year may experience a real life example of his Law.
The past 6 year changes, saw hopes that a new year will experience an application of Stein’s Law to the suppression of precious metal prices, so far without success. That, too, is a process which cannot continue indefinitely. May we again state the hope that this time 2018 will be the year when their prices break free, assisted and triggered by the continuous flow of precious metals from west to east. While this flow also cannot last indefinitely, it can continue until little or no metal is left in the west. That will mean price suppression using Comex has to taper off and end.
2017 was not a good year for the dollar. The dollar index started the year off at 102.29 and ended at 91.83 – a decline of just more than 10%, which is much for a currency. The euro gained 14% against the dollar, from $1.0516 to $1.1998, while the dollar held better against some other currencies, but still lost ground. The trend of the dollar was consistently lower, until a brief rally from mid-September, which has failed against the euro and other currencies and the precious metals. 2018 seems set to continue the trend.
Best wishes to all readers for a prosperous 2018, good health and peace.
Euro-Dollar
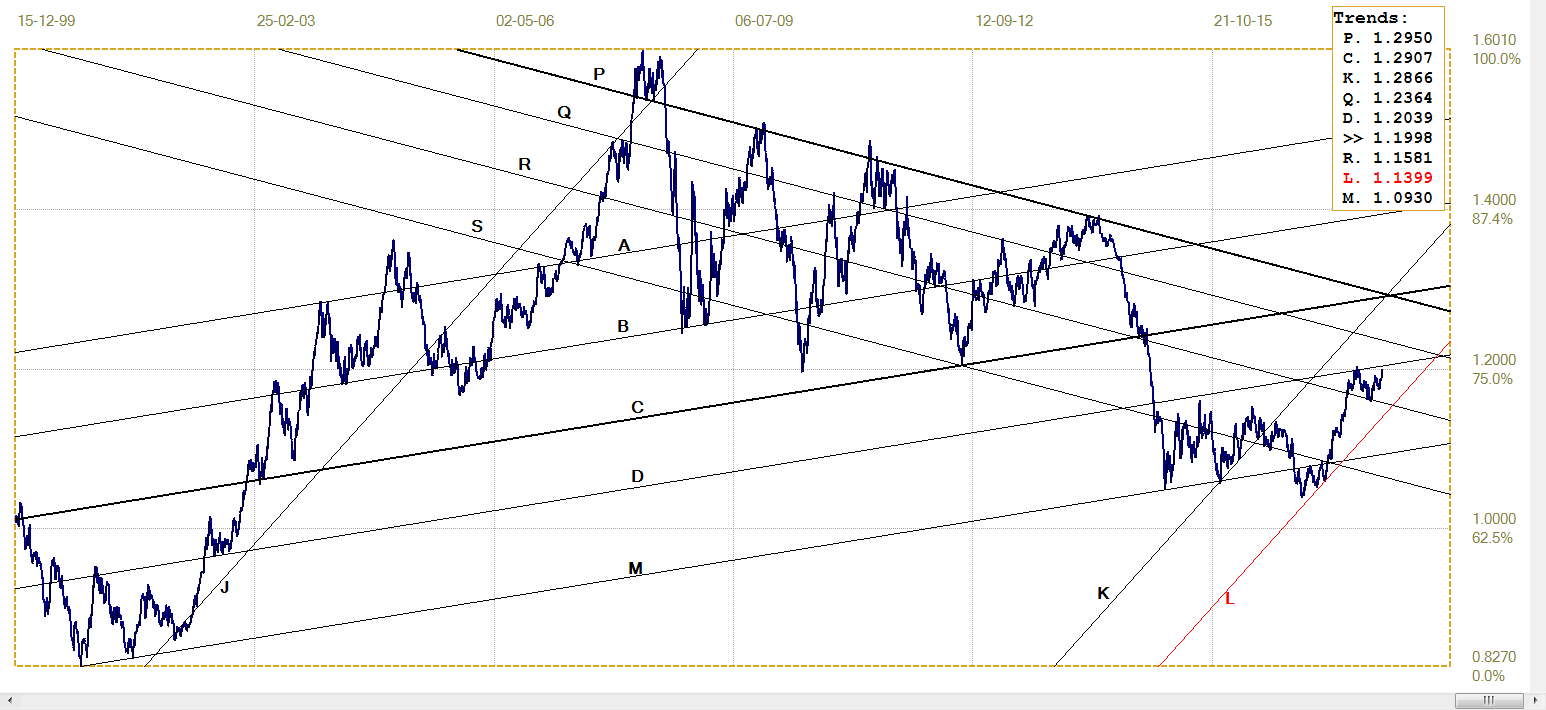
Euro-dollar, last = $1.1998 (www.investing.com)
A bifurcated break often acts as the end of a significant trend. The steep bear trend first settled sideways above line M, with good volatility, before forming a bifurcated break below line M ($1.0930). The bull trend that had started with the break back above line M is now well established in bull channel KL ($1.1399). Resistance at line D ($1.2039) ended the bull trend, followed by the correction to test support at line R ($1.1581), which held. A break above line D is needed to resume the bull trend, but as DR is developing as a megaphone formation, normally a strong chart pattern, the break higher should be delayed
DJIA
A new master gradient, between two widely separated points in the chart – both of which were all time highs of their time – offers a more objective master gradient for the derivation of the top trend line of the pattern. Now it seems the best fit of the current resistance at line A (24 927) has the trend line acting as support for the bull market of the 1980s and it is no longer anchored in the 1987 high.
The all time high, so far, on Thursday last week is well within 0.5% from line A that is used as the limit to assume a (close) intersection between a trend line and chart – a close enough fit 30 years after the point in 1986 that was used for the origin of line A, with the trend line also passing within 0.5% of the November 2004 high.
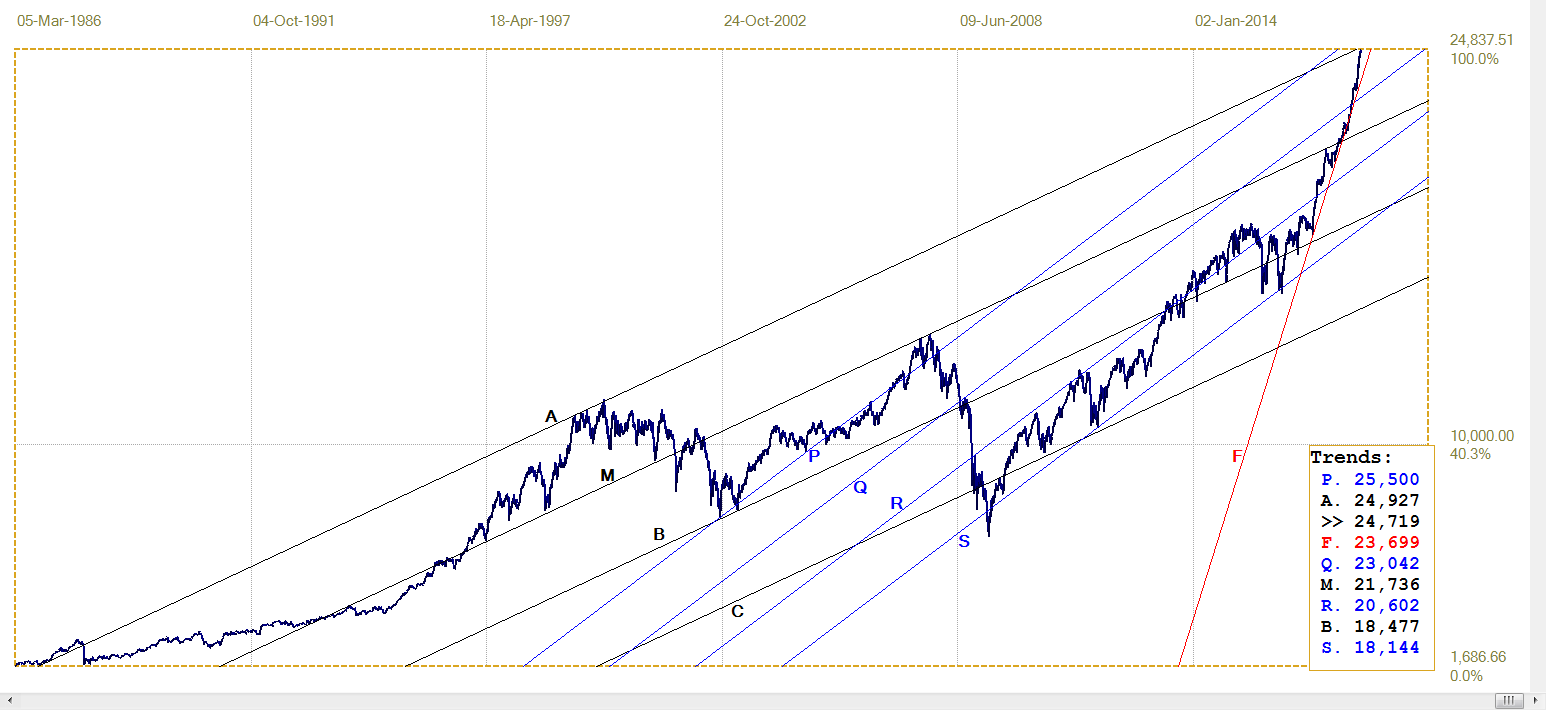
DJIA, last = 24719.22 (money.cnn.com)
Gold PM fix - Dollars
Last Friday there was again a jump in the price of gold just before the start of the second long weekend. The jump, to close at $1303/oz, again does not appear on the chart, as there is no PM fix on the last trading day before the New Year. Adding that price to the chart would have reached to line S ($1303).
Any further extension of the recent rising trend into the New Year therefore would have gold breaking above the large pennant formation SG for a bullish bias – if the break higher should hold and extend.
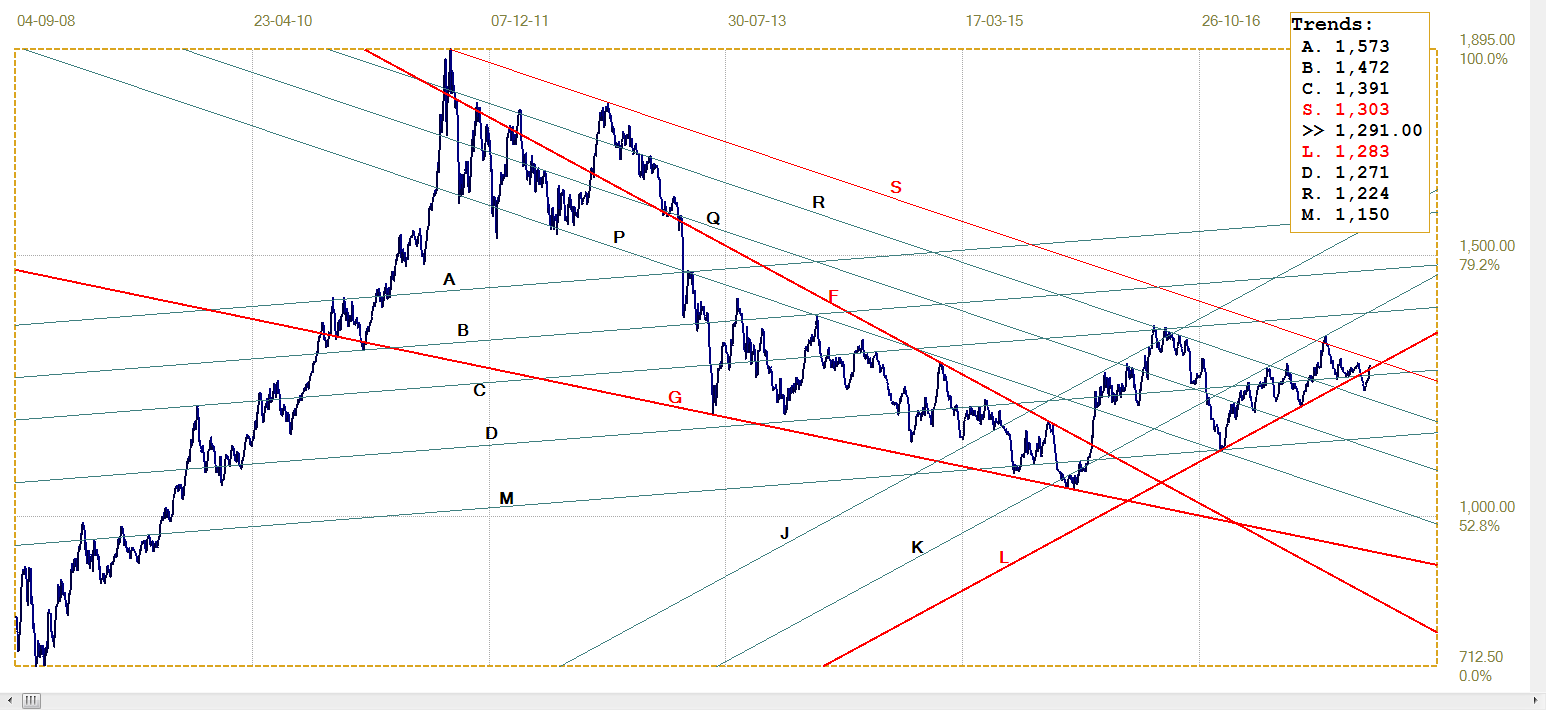
Gold price – London PM fix, last = $1291.00 (www.kitco.com )
Euro-gold PM fix

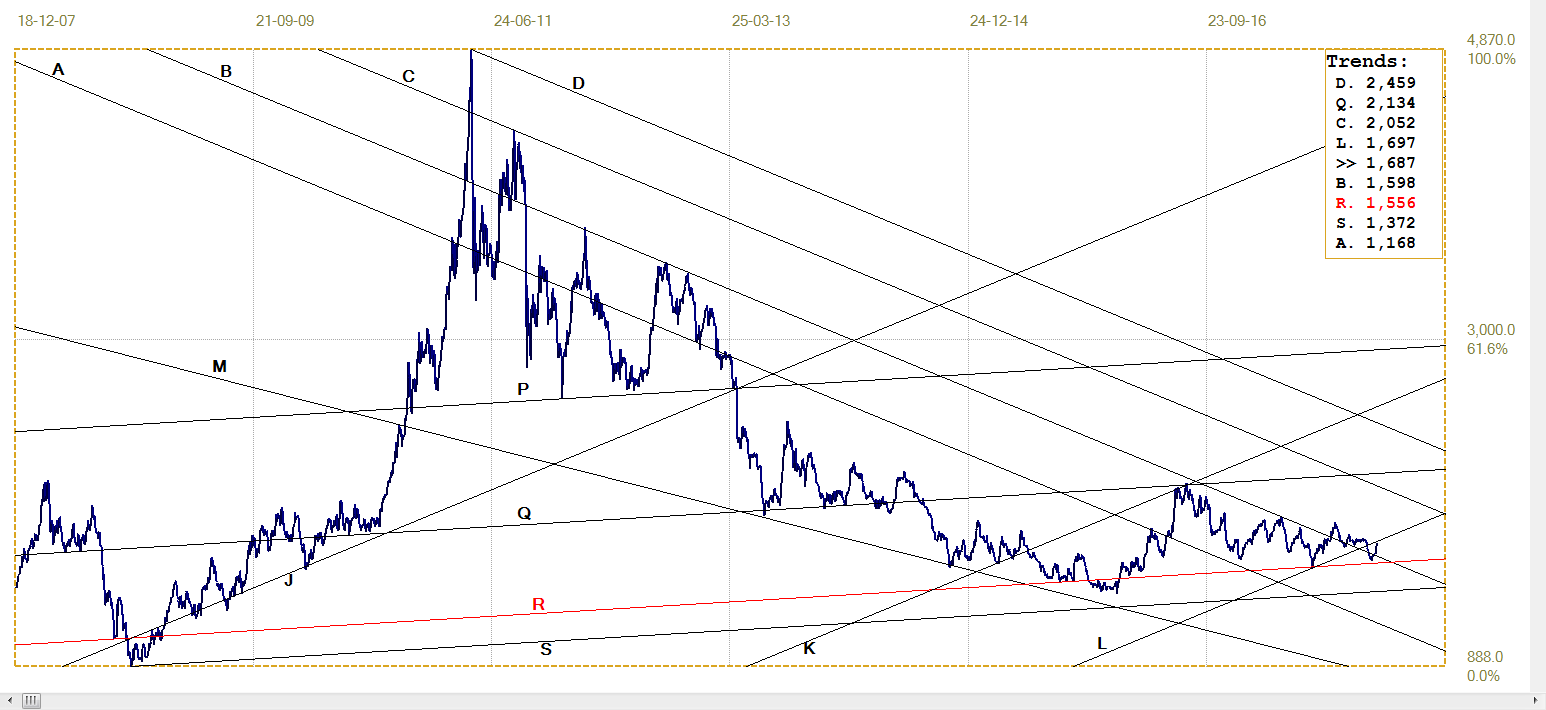
Euro gold price – PM fix in Euro, last = €1080.4 (www.kitco.com)
The above chart also does not include the jump in the price of gold on the Friday before the New year. Using the closing price for gold and of the euro to result in €1086/oz, extends the break above line C (€1077). It nevertheless requires further gains to break above lines T (€1091) and Z (€1096) to confirm and then establish the new trend.
Silver Daily London Fix
Silver daily London fix, last = $16.865 (www.kitco.com)
Silver had its London AM fix on Friday at $16.865, but the price jumped later in US trading, joining gold in achieving a significant break to close out the old year. Silver broke above $17.00 with a good margin, but then pulled back to end at $17.02. It still holds a good portent for 2018 provided the 417,00 level can now act as a floor to offer good support.
U.S. 10-year Treasury Note
A week ago, the chart showed the yield on the 10-year US Treasury note closed the week before Christmas with a break above line W (1.471%) to give a clear bearish signal. Last week, the bond market rallied steeply to bring the yield back below line W and also below the steep line D (2.443%). It nevertheless held above the very steep line L (2.405%) – which has guided the recent weakness in the market – to end right at the trend line. The rally has to extend lower, breaking below line L, if 2018 is to begin with a bullish bias.
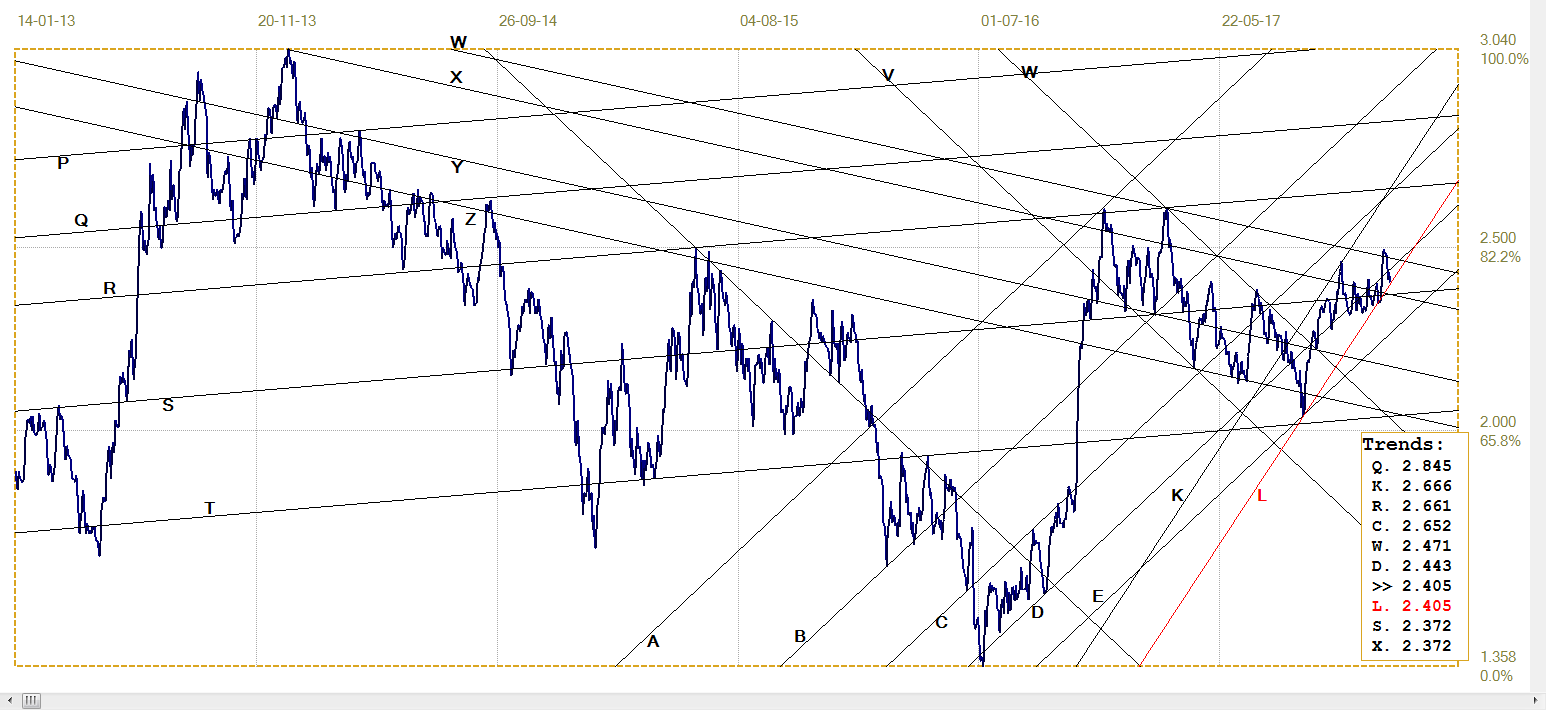
U.S. 10-year Treasury note, last = 2.405% (www.investing.com )
West Texas Intermediate crude. Daily close
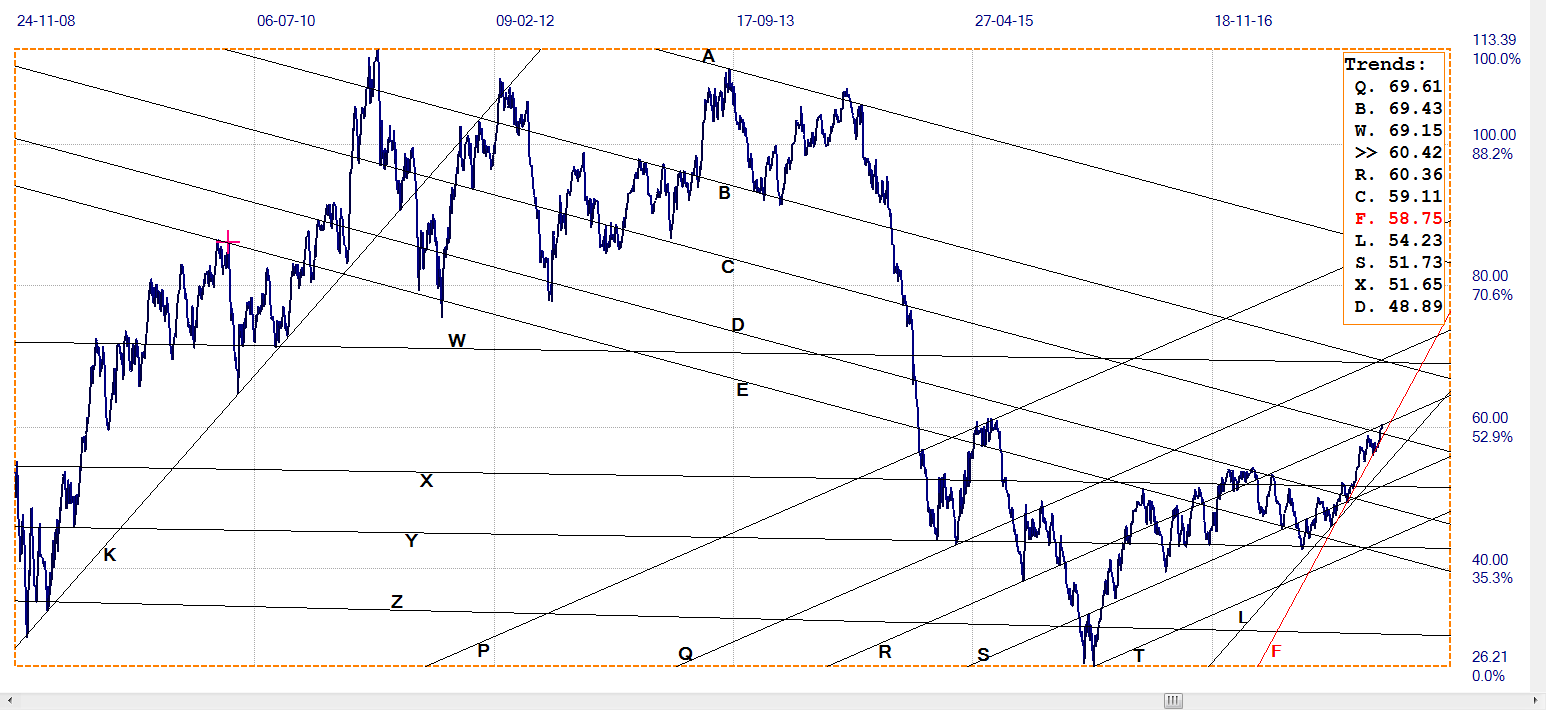
WTI Crude – Daily Close, last = $60.42 (www.investing.com )
The price of crude has been holding close the steep support of line F ($58.75) for some time, creeping higher along the support line to first break above resistance at line C ($59.11) and now ends the old year just at resistance of line R ($60.36). The trend has been bullish ever since the break above channel YX ($51.65) in which the price had mostly spent such a long time, but is now being squeezed between lines R and F. The direction of the break as 2018 begins should indicate what the near to medium term trend will be.
¬2017 daan joubert, Rights Reserved chartsym (at) gmail(dot)com
share
share
share
share
share