Historic Gold Stocks Volume Signal
 share
share
 share
share
 share
share
 share
share
 share
share
UUP (US Dollar Proxy) Distribution Chart
When studying charts, I keep a very close eye on volume. Recently, there was a huge distribution day on this US dollar proxy chart. Technically, heavy volume is most ominous, when it comes at the end of a rally.

· Interestingly, this volume occurred right before a Fed statement that was very dollar-bearish. The price plunge came because Bernanke promised to continue low interest rate policy.
· That was a rather bizarre and shocking “about-face” change, from his prior statements about tapering QE. The Fed seems to be showing the market that it has little interest in letting the dollar rise very much at all.
Gold COT Signals Chart
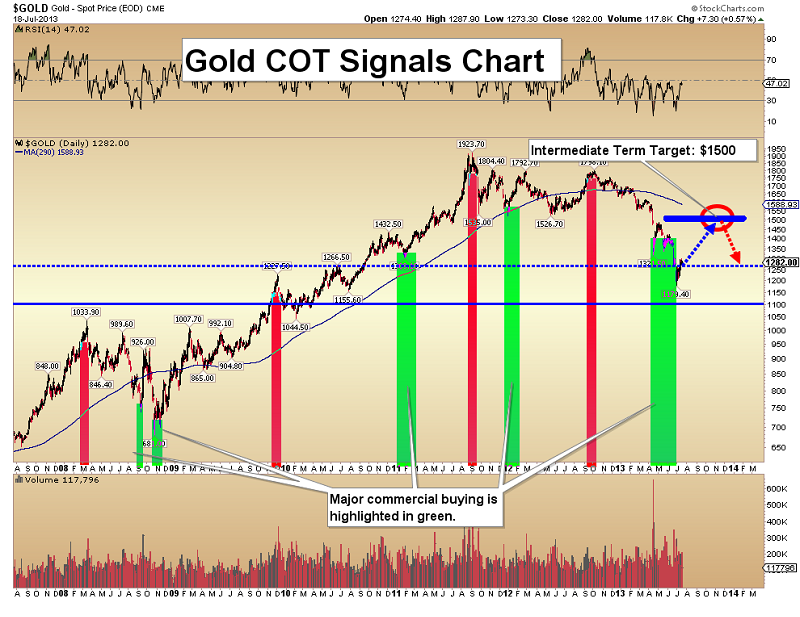
· This chart roughly demonstrates what commercial traders have done in the gold market, since 2008. The current price decline has put a fair amount of gold and silver into very strong hands.
· My intermediate term target is $1500.
GDX Fuel Cell Volume Chart
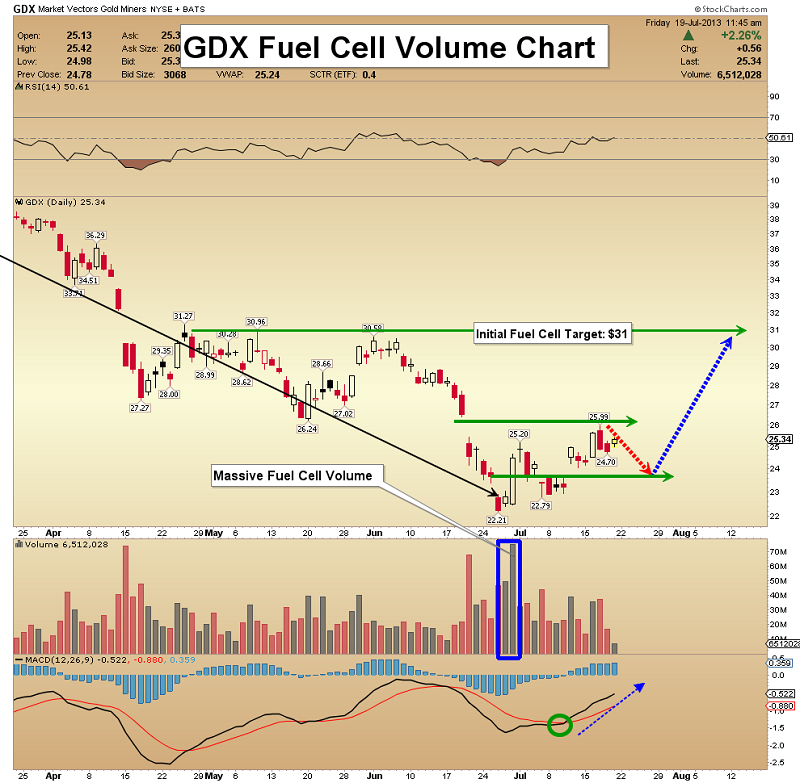
· The FCI (my proprietary fuel cell volume indicator) is suggesting that after a slight pause next week, the current gold stock rally should gain momentum.
· Although there have been some rough days since the FCI signal occurred, up volume is dominating the action.
GDX Versus Gold Chart Chart

· I am using GLD-NYSE as a proxy for gold on this ratio chart, because volume is superb. An enormous FCI signal occurred on Tuesday. Investors who see the significance of this event should move some funds immediately, from bullion to gold stocks.
· This is the heaviest volume signal in the history of this ratio chart.
· The other technical event that is worth noting on the ratio chart is the strong MACD positive divergence.
· Positive technical divergences don’t offer instant gratification, but they give patient investors time to take action.
GDXJ Fuel Cell Volume Chart
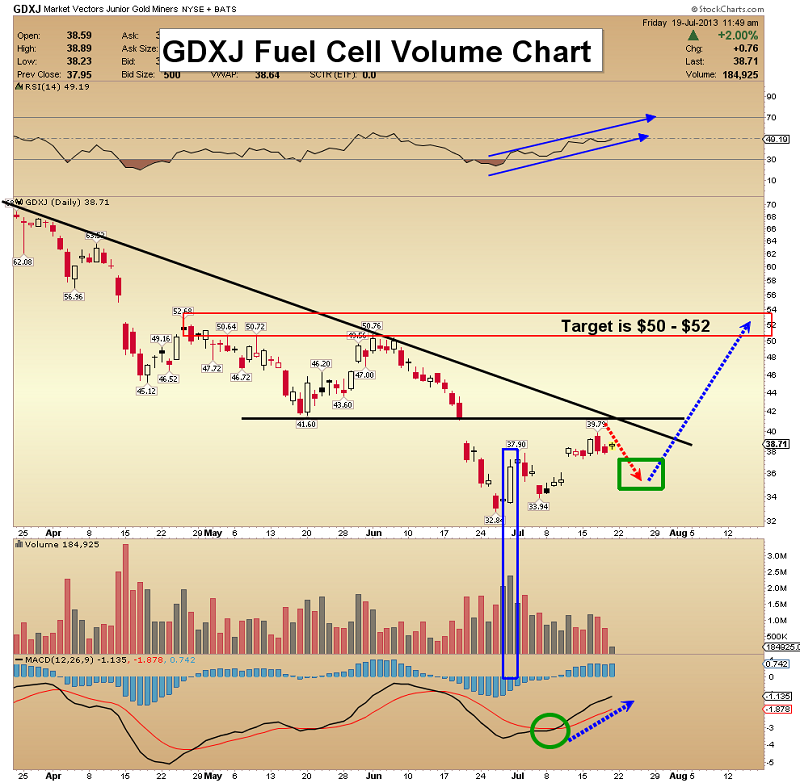
· The fuel cell indicator for junior stocks is not as clear as it is for the intermediate and senior ones. Volume has not surpassed the levels of the April panic.
· That’s not really a concern. Gold bullion tends to lead silver at the start of a rally. Likewise, senior gold stocks tend to lead junior stocks in the early stages of a rally, and then the juniors begin outperforming.
· After a slight pause next week, I’m projecting a rally to the $50 area.
Silver Versus Gold Chart

· Against gold, silver appears to be “carving” out a rounding bottom formation.
· Note the MACD indicator, which is trending higher.
· China is apparently preparing to substantially increase their use of solar power, and a fair amount of silver is required to do that. Also, India has enacted a ban on gold bar and coin sales. Silver could benefit from increased buying there, if the ban isn’t lifted soon.
· Silver has a cyclical tendency to bottom against gold, about once every 4 weeks. My recommendation is to buy silver now, and more if it drops next week, to take advantage of the current cycle!
Unique Introduction For Gold-Eagle Readers: Send me an email to [email protected] and I’ll send you 3 of my next Super Force Surge Signals, as I send them to paid subscribers, to you for free. Thank-you!.
Stay alert for our Super Force alerts, sent by email to subscribers, for both the daily charts on Super Force Signals at www.superforcesignals.com and for the 60 minute charts at www.superforce60.com
About Super Force Signals:
Our Super Force signals are created thru our proprietary blend of the highest quality technical analysis and many years of successful business building. We are two business owners with excellent synergy. We understand risk and reward. Our subscribers are generally successful business owners, people like yourself with speculative funds, looking for serious management of your risk and reward in the market.
Frank Johnson: Executive Editor, Macro Risk Manager.
Morris Hubbartt: Chief Market Analyst, Trading Risk Specialist.
Email:
Super Force Signals
422 Richards Street
Vancouver, BC V6B 2Z4
Canada
share
share
share
share
share