History Of U.S. Bear & Bull Markets Since 1929


Based upon stock market history since 1929, a Stocks Bear Market inevitably looms on the horizon…in the near future.
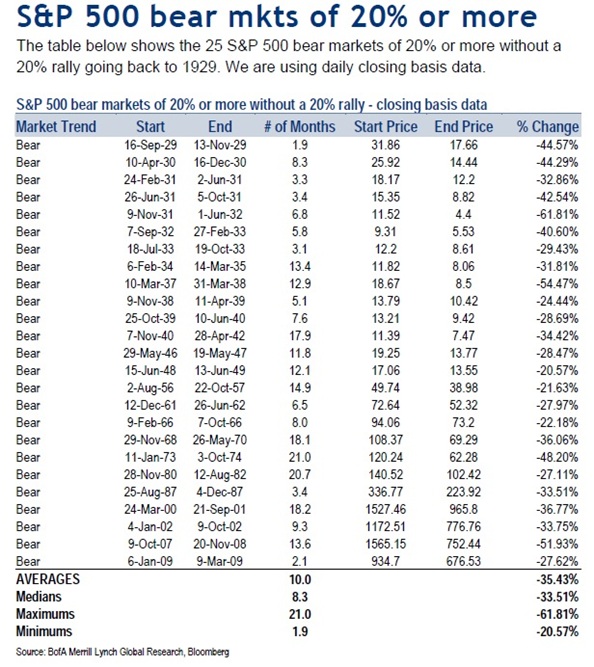
Below is an accounting of all BEAR MARKETS since 1929. For the sake of clarity, a BEAR MARKET is defined by the S&P500 falling at least 20%.
Here is the upshot of BEAR MARKET HISTORY:
- Since 1929 there have been 25 Bear Markets
- The average Bear Market period lasted 10 months
- The average Bear Market loss was -35% (The smallest loss was -21% in 1949, and the largest loss was -62% registered in 1932)
- Average frequency of Bear Markets since 1929 is every 3.4 years
- The last Bear Market ended in March 2009. Therefore, another Stocks Bear Market looms - as the present BULL MARKET is quite long in the tooth with 4.2 years to date.
NOTWITHSTANDING the recent STOCK MARKET RECORDS forged last week in Wall Street; and despite the media’s Irrational Exuberance in touting the 15000 DOW and wishfully looking at possibly 16000 by yearend, history is testament THE BEARS WILL EVENTUALLY AND INEVITABLY RETURN. And although the currently evolving momentum in common stocks is very bullish, that could change in a heartbeat with new unexpected announcements….e.q. for example: the Fed says NO MORE QE, or we go to war in the Middle-East, or the Euro Union craters suddenly, or whatever is NOT known right now.
The cycles of BULL & BEAR market history are immutable ...only the people change.
THIS BULL MARKET IS OLD & GRAYING… AS IT IS ALREADY LONG IN THE TOOTH
Based upon stock market history since 1929, the current STOCKS BULL is getting quite old.
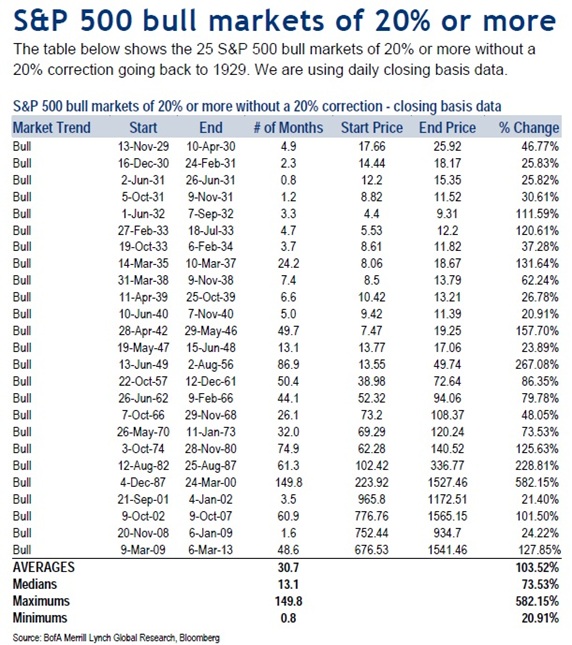
Below is an accounting of all BULL MARKETS since 1929. For the sake of clarity, a BULL MARKET is defined by the S&P500 Rising at least 20%.
Here is the upshot of BULL MARKET HISTORY:
- Since 1929 there have been 25 BULL Markets
- The average Bull Market period lasted 31 months
- The average Bull Market gain was +104% (The smallest gain was +21% in 2001, and the largest gain was +582% registered in period 1987-2000)
- Average frequency of Bull Markets is every 3.4 years
- The present Bull Market is already 50 months old, which means this BULL MARKET is quite long in the tooth in lasting 4.2 years to date vs the 3.4 year average since 1929.
What I said above BEARS repeating (pardon the intended pun): NOTWITHSTANDING the recent STOCK MARKET RECORDS forged last week in Wall Street, and despite the media’s Irrational Exuberance touting the 15000 DOW and wishfully hoping for 16000 by yearend, history is testament THE BEARS WILL EVENTUALLY AND INEVITABLY EMERGE. And although the evolving momentum in common stocks is today very bullish, that could change in a heartbeat with any new announcements….e.q. for example: the Fed says NO MORE QE, or we go to war in the Middle-East, or the Euro Union craters suddenly, or IRRATIONAL EXUBERANCE runs its course to a full-scale blow-off peak, which terminates in a precipitous correction…like in 2008 when the S&P500 plummeted -52% in the subsequent 13 months. TO BE SURE IT CAN AGAIN HAPPEN.
The cycles of BULL & BEAR market history are immutable ...only the magnitude, duration and players change.
The only factor that remains immutable across the millennium is the irresistible ever increasing VALUE OF GOLD. To doubt this will cost you unimaginable financial loss in the purchasing power of your savings and retirement nest egg. Don’t risk the happiness of a comfortable and happy retirement with your loved ones.
DISCLOSURE:
I am 75% invested in gold and silver mining stocks…and will continue accumulating more as the gold price rises.
More from Gold-Eagle


